1. What is the Neptis Geoweb?
2. How is the Geoweb organized?
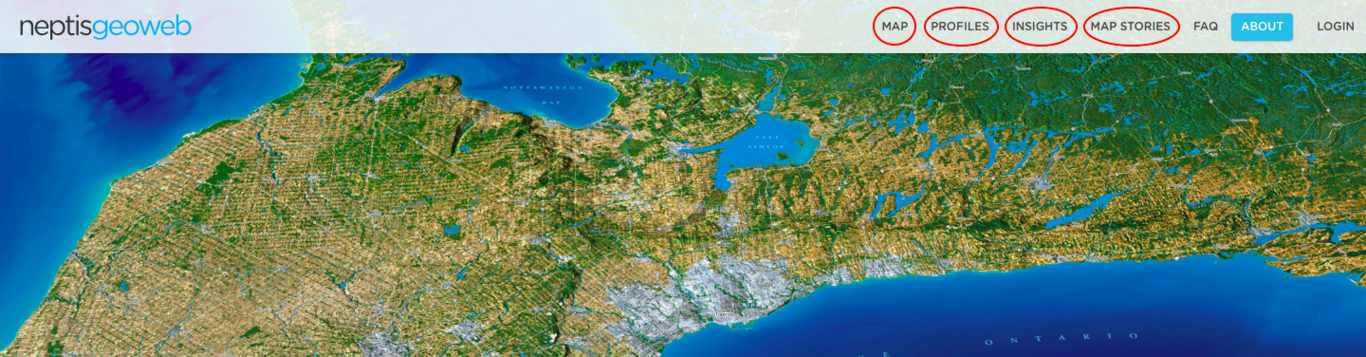
3. How is the MAP section organized?
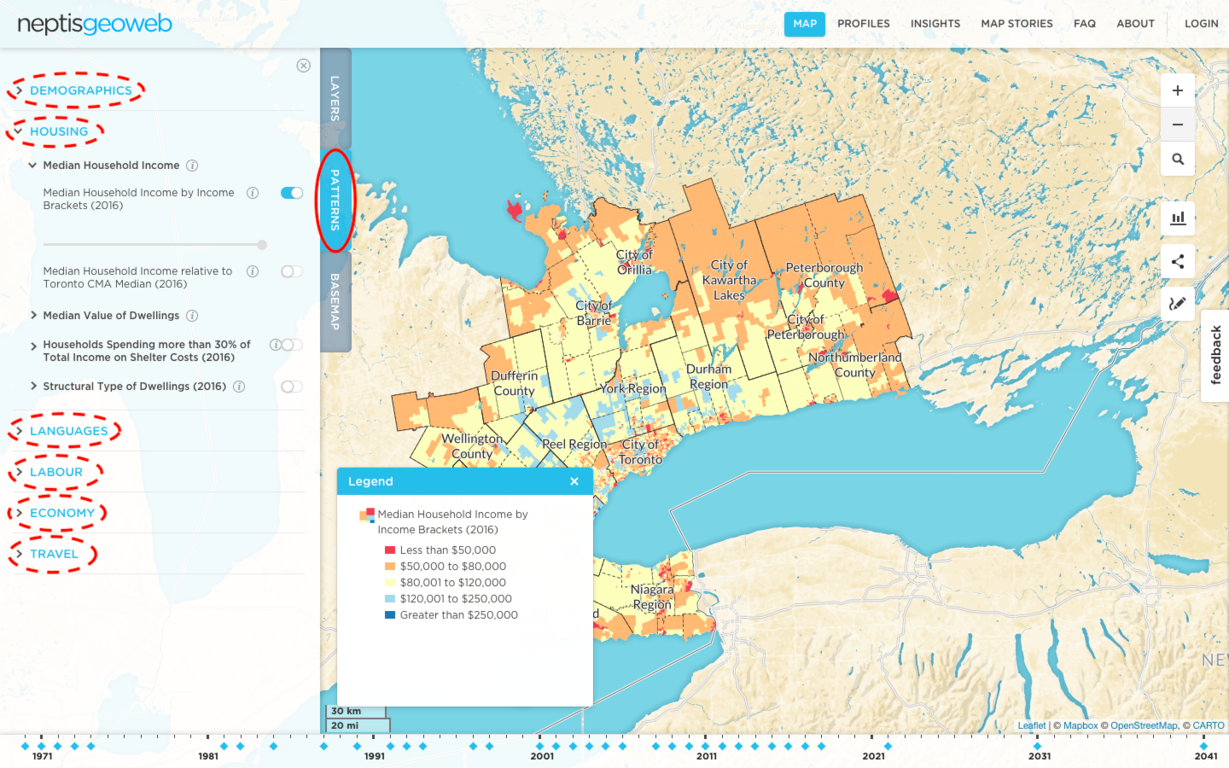
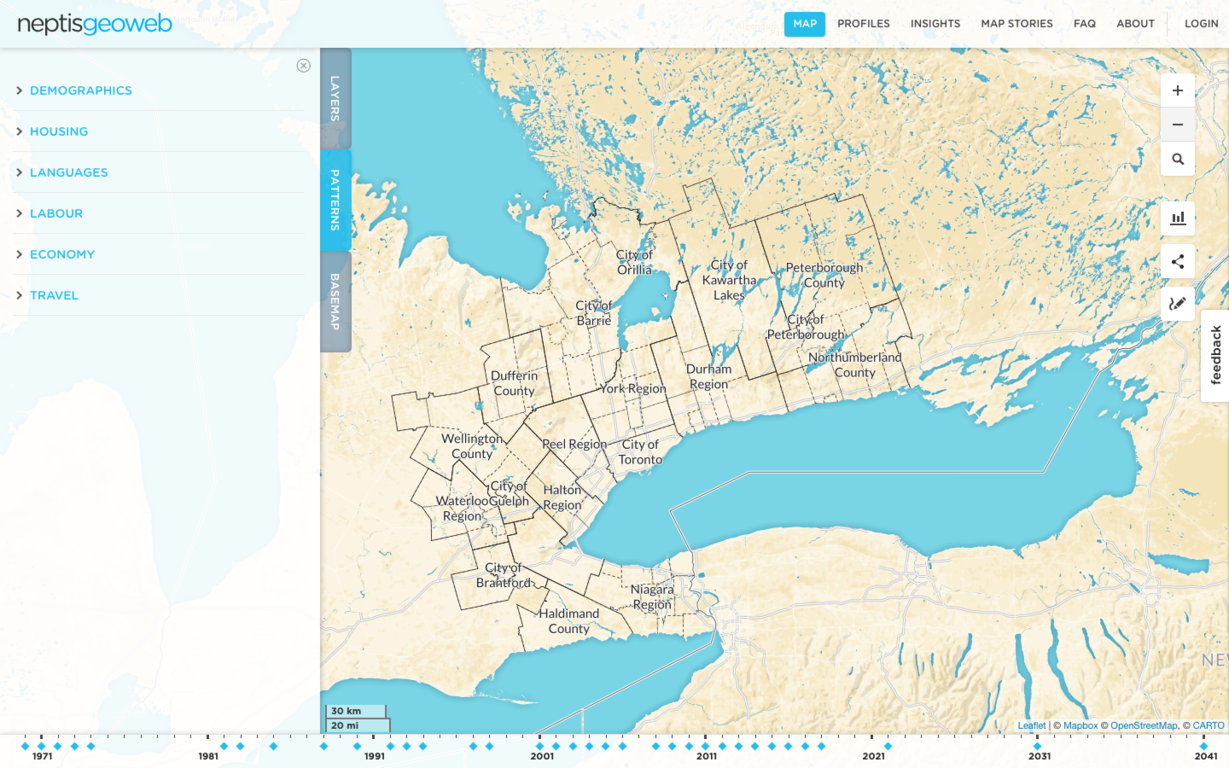
Upon arrival on the Geoweb, a user encounters a map of the municipalities that comprise the extended Toronto region which is also referred to as the Greater Golden Horseshoe. The opening Map page invites users to choose map Layers from the side menu to create their own map choosing from the themes: Land Use, Agriculture & Environment, Transportation.

Alternatively, by navigating to the Patterns tab, a user can create a map with featured data from Census of Canada or the Transportation Tomorrow Survey found under themes: Demographics, Housing, Languages, Labour, Economy, and Travel.
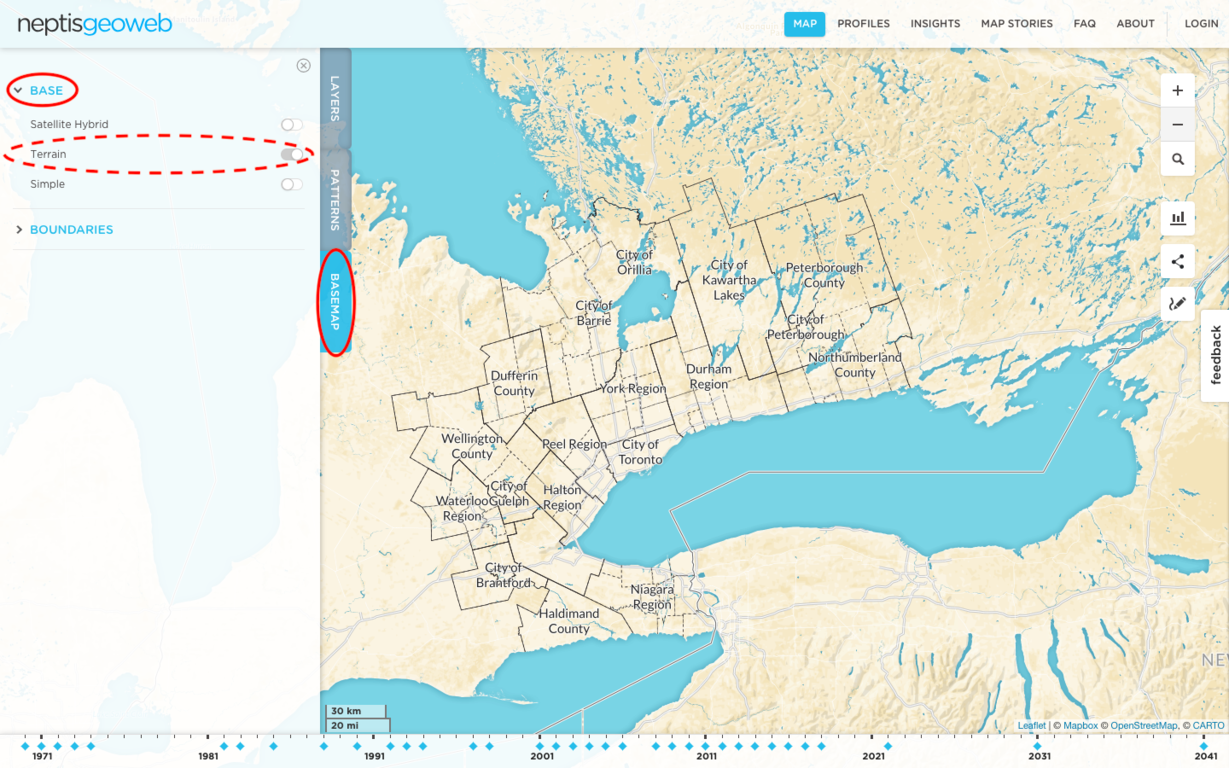
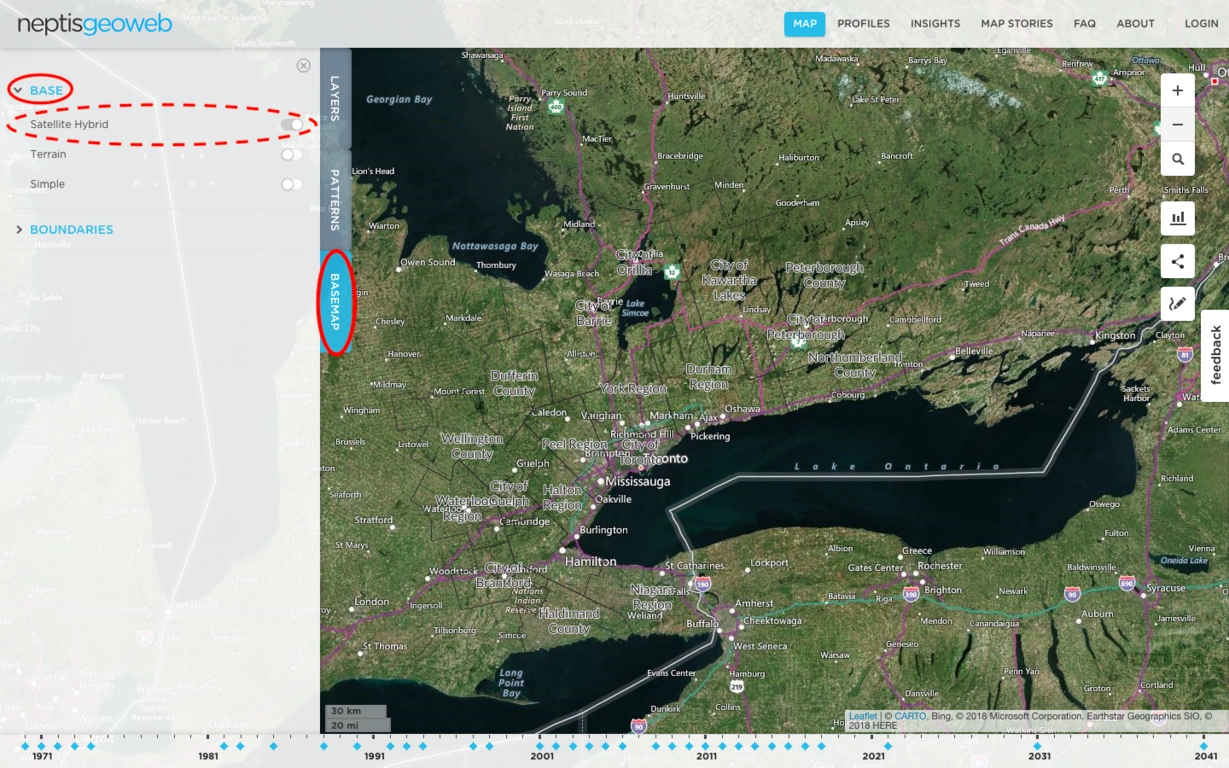
To change the “canvas” upon which a user can build a map, navigate to the Basemap tab. The default basemap is a terrain map which highlights heights and natural depressions on the landscape.
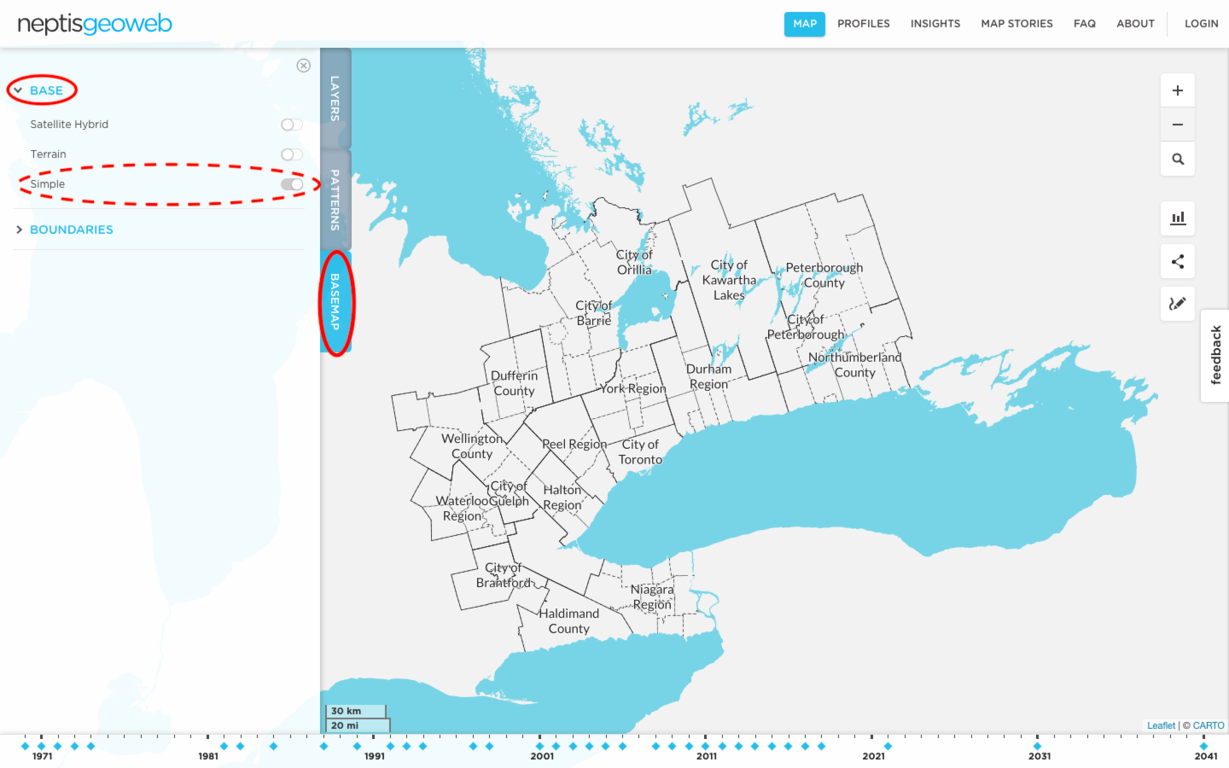
The “canvas” can be changed to a white background using the Simple map.
Finally, the “canvas” can also be changed to imagery basemap using Satellite Hybrid which features the latest Bing satellite imagery.
4. What can I find in the PROFILES section of the Geoweb?
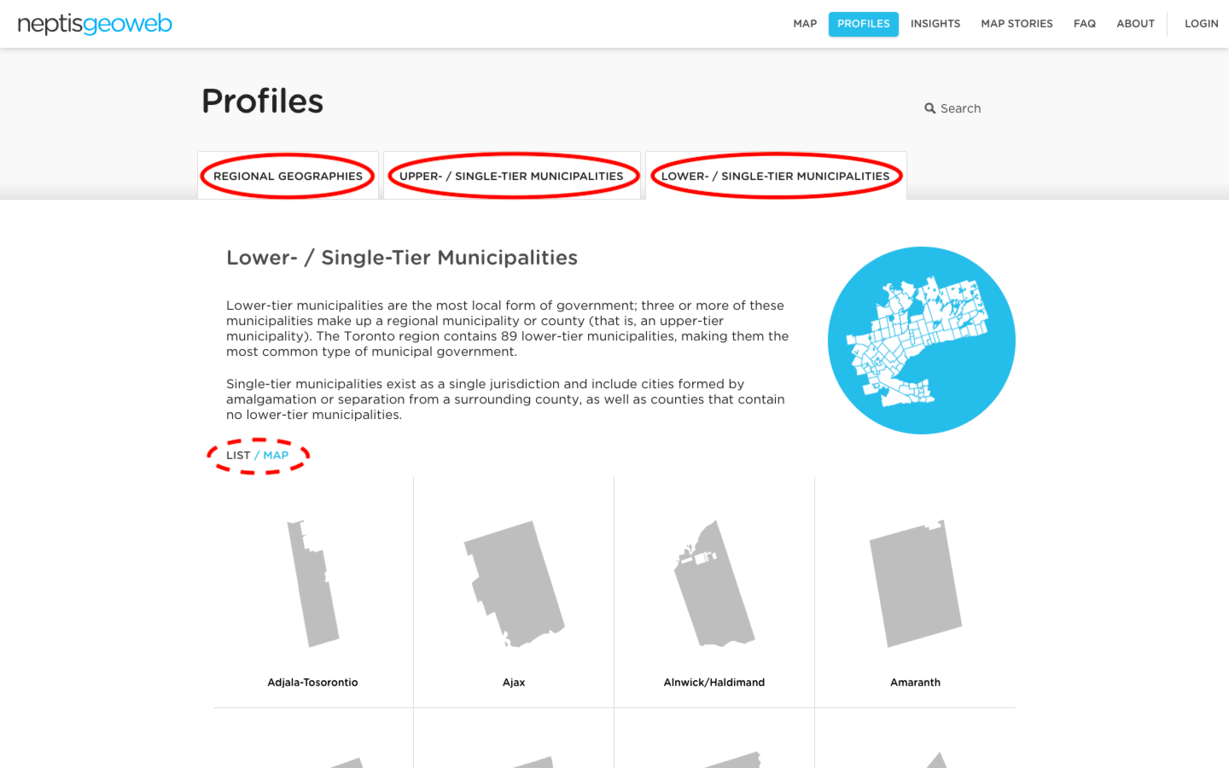
The Profiles section of the Geoweb contains a snapshot of land use, demographic, housing, cultural, and economic conditions for over for 115 different geographies in the region at three different scales—lower-tier municipalities, single- or upper-tier municipalities, and regional geographies.
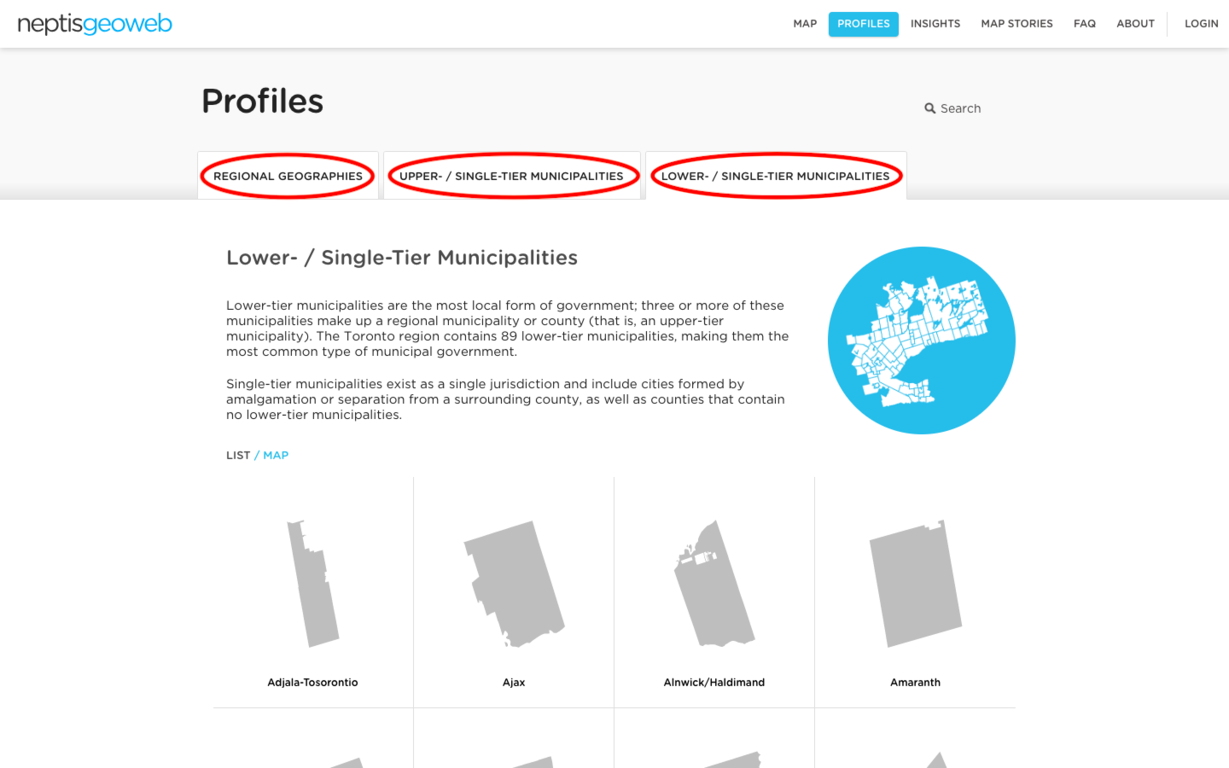
Users can find their geography of interest using a List or Map.
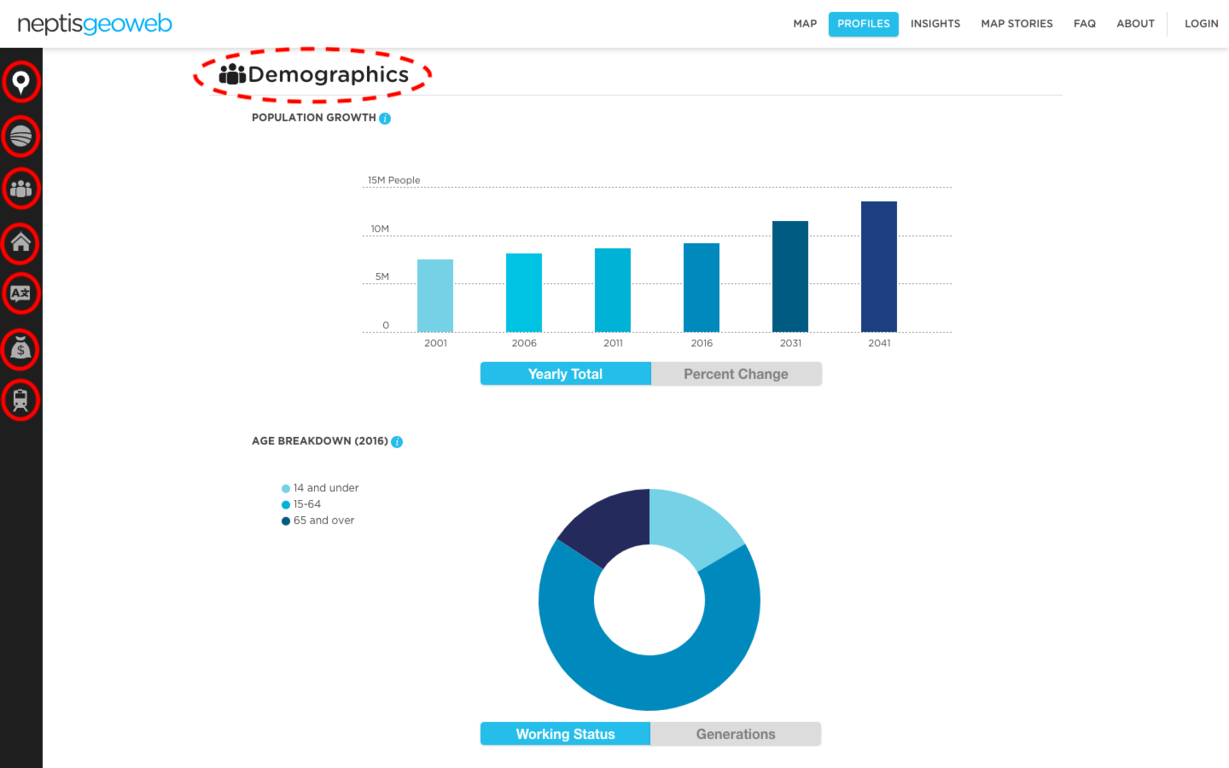
The side menu icons help guide users through 80+ indicators to provide an overview of communities in the region.
5. What can I find in the INSIGHTS section of the Geoweb?
The Insights section of the Geoweb contains visual narratives created by staff members as way of showcasing different map layers and data sets featured on the Geoweb. Some Insights focus on the juxtaposition of map layers which may reveal and inform public debates on an issue such as transit planning or access to jobs. Other Insights combine data from Map and Profiles section to tell a historical story such as how and where the population has grown over time.
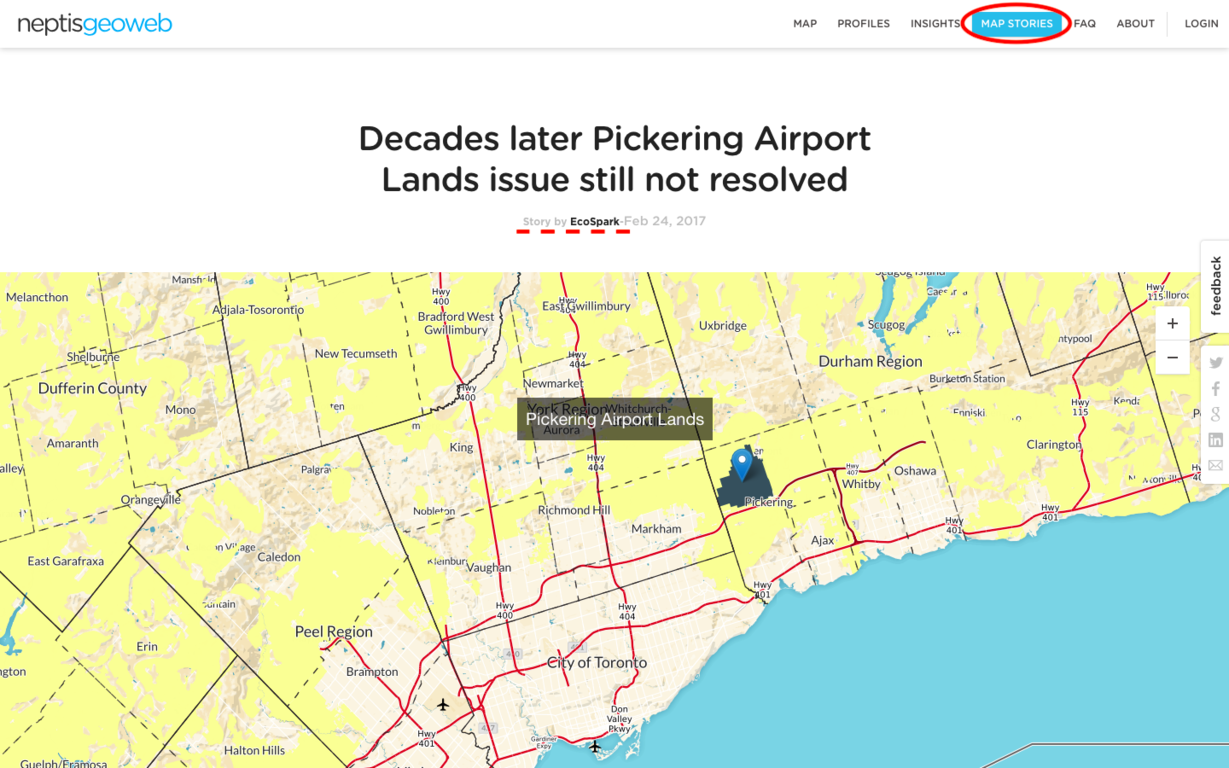
6. What can I find in the MAP STORIES section of the Geoweb?
The Map Stories section of the Geoweb is where users can contribute content. Map Stories allows users of the Geoweb to make a map, describe the significance of the map, tag it with a relevant thematic category (e.g. Land Use, Transportation, Economy, Agriculture, Environment), and share it on the Geoweb. For instructions on how to create a Map Story, click here (add a link to FAQ link below).
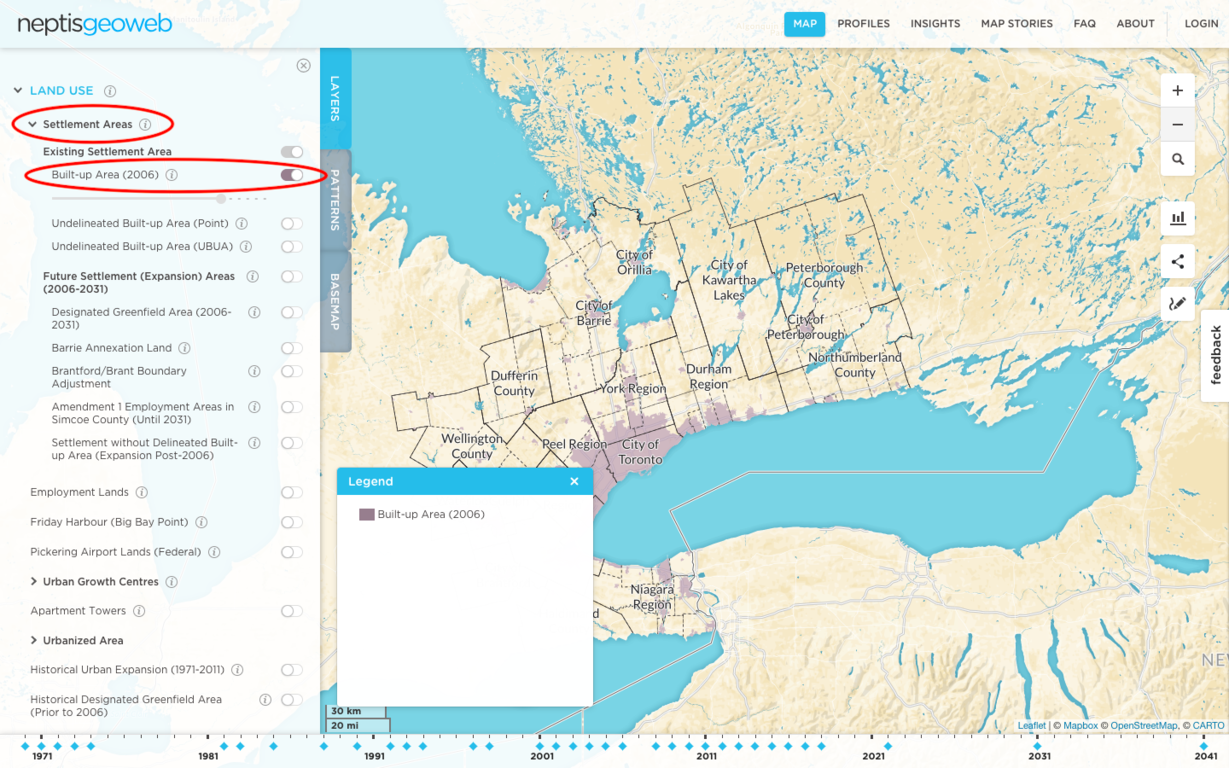
7. What map layers are found in LAND USE?
LAND USE map layers illustrate where development has occurred and where development is planned in the urban and rural communities of the Greater Golden Horseshoe. It also contains key policy layers that influence the shape of development, such as the Urban Growth Centres and Employment Lands. The LAND USE layers can be turned on and off using the toggle switch.
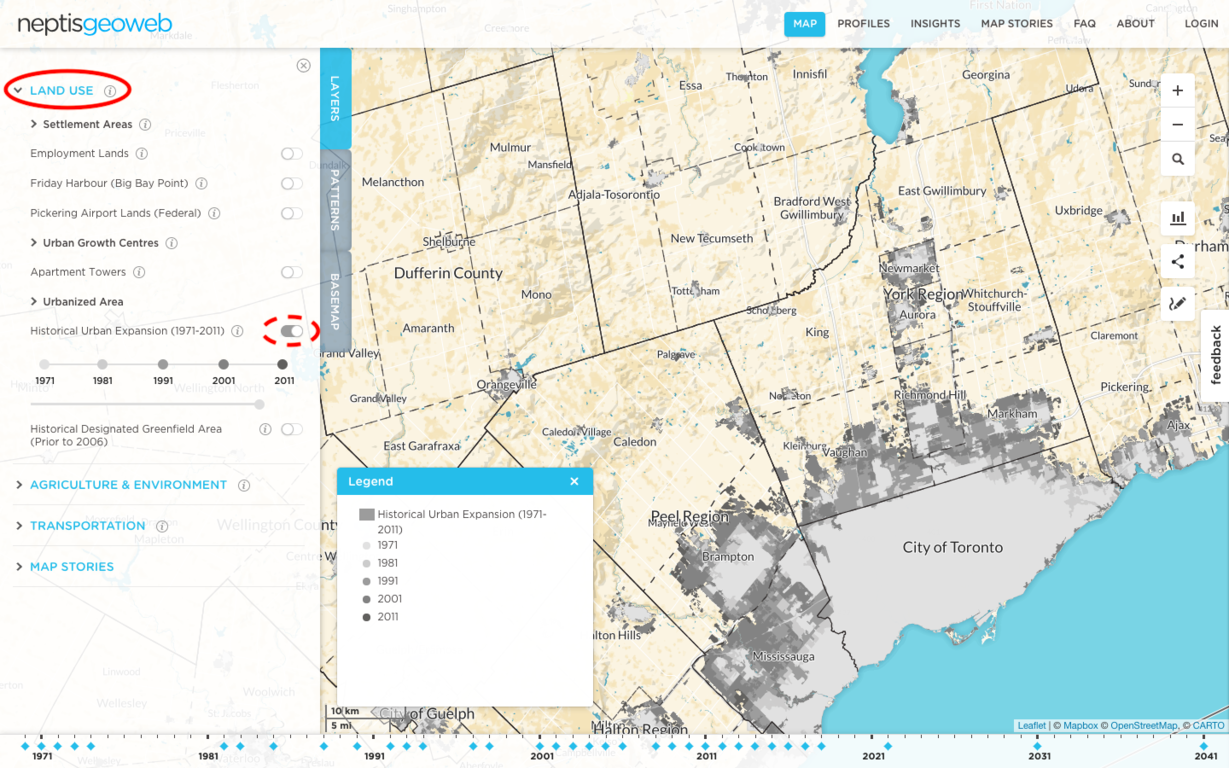
Some LAND USE map layers are grouped. The group can be expanded and reveal more layers by clicking on the > symbol which will turn 90 degrees clockwise into a down arrow position when activated.
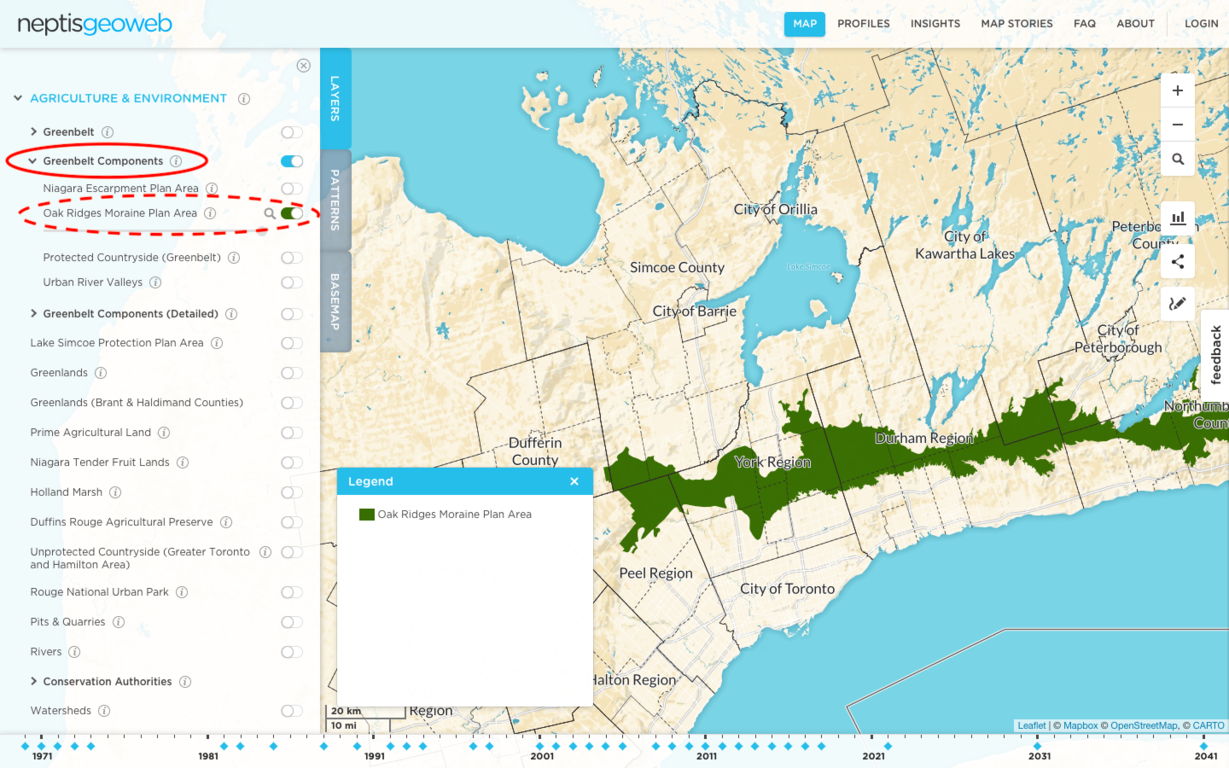
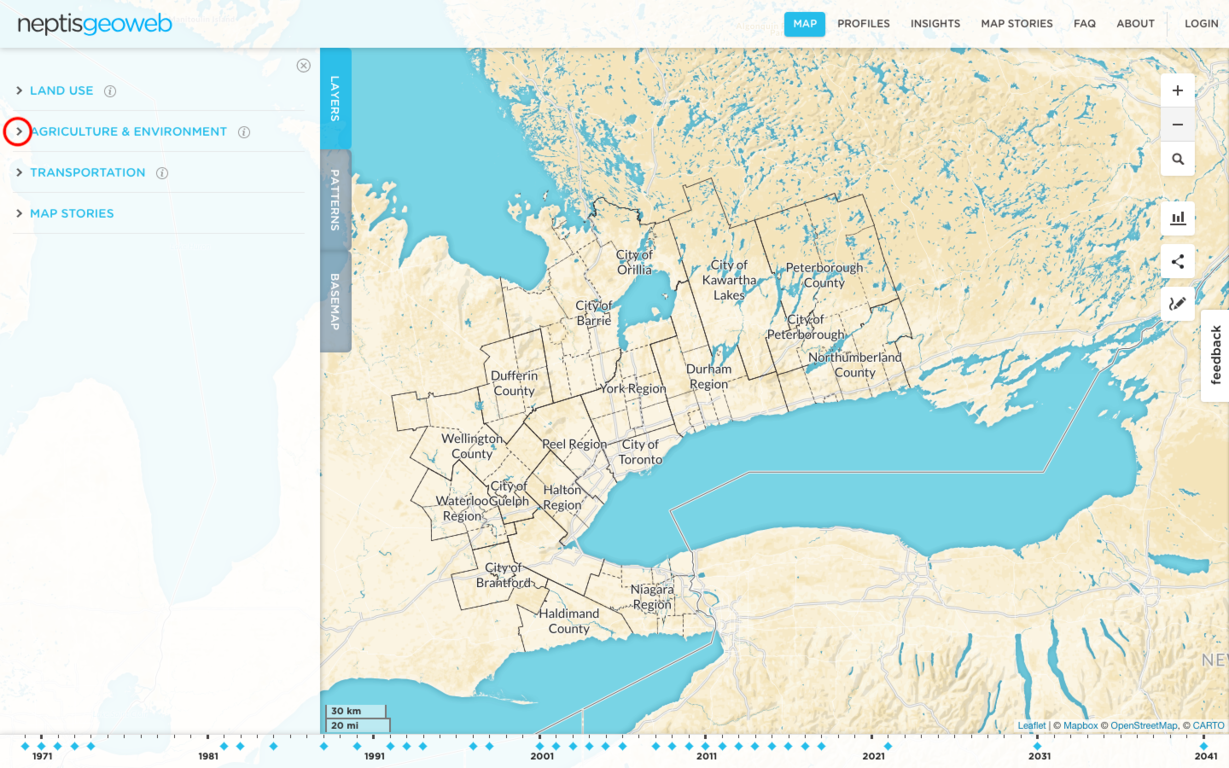
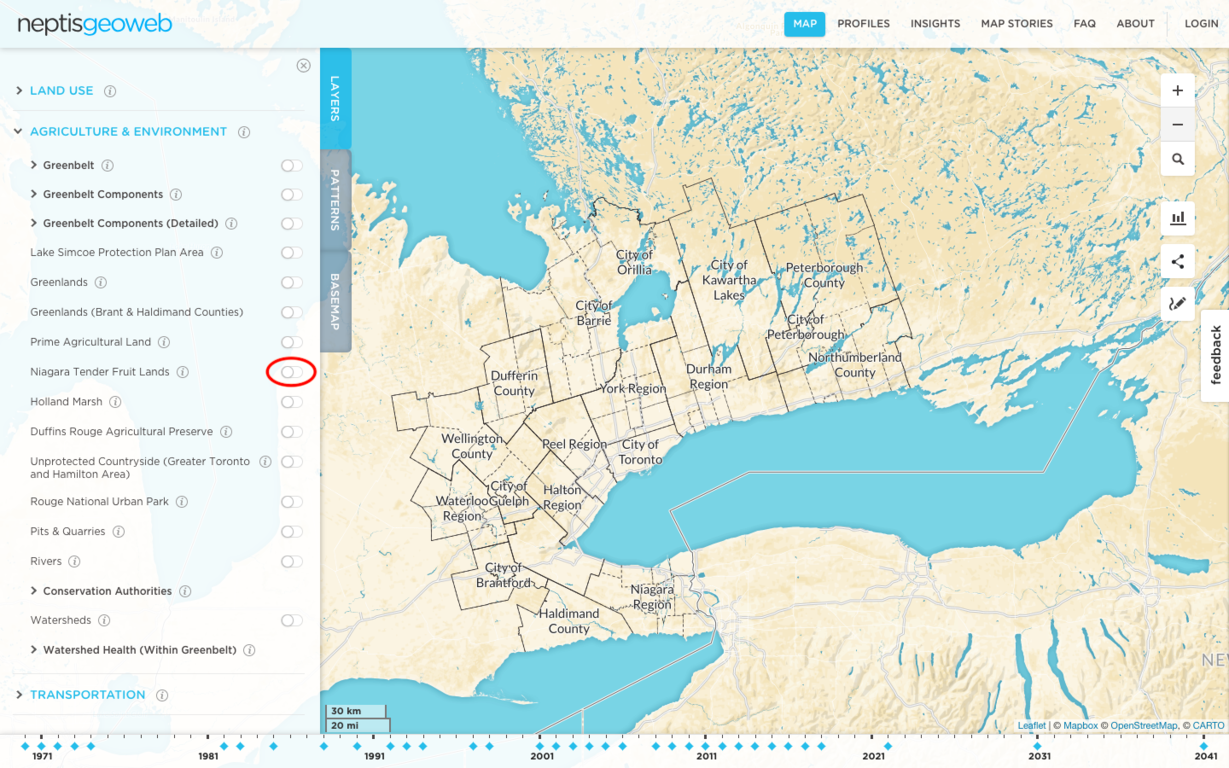
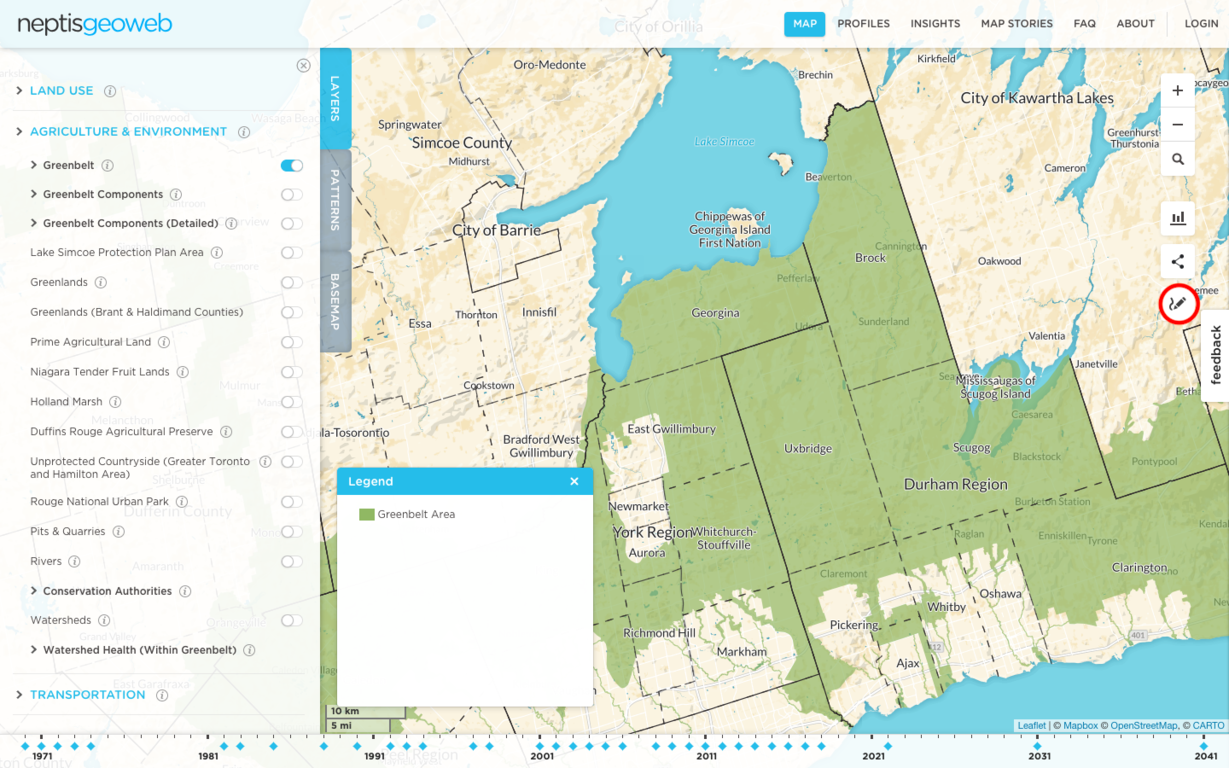
8. What map layers are found in AGRICULTURE & ENVIRONMENT?
The AGRICULTURE & ENVIRONMENT map layers illustrate farmland and related policy layers, natural heritage features, conservation and protected areas.
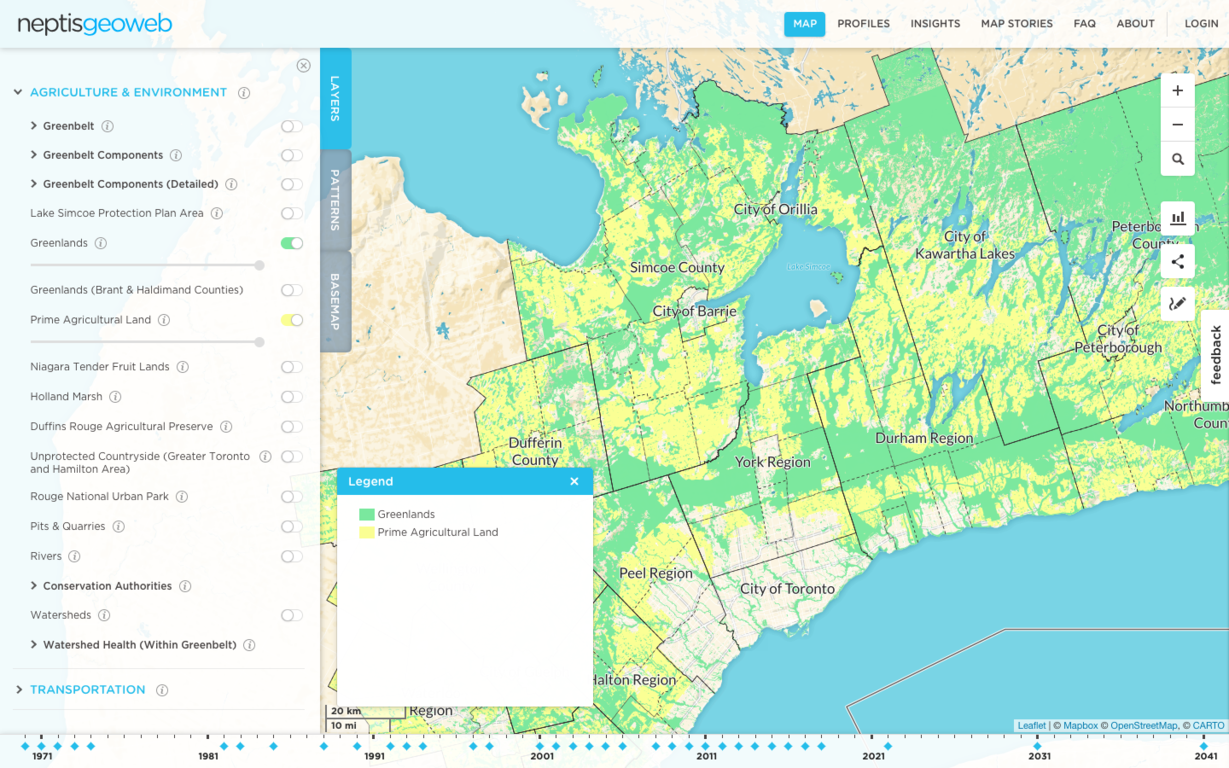
Some AGRICULTURE & ENVIRONMENT map layers are grouped. The group can be expanded and reveal more layers by clicking on the > symbol which will turn 90 degrees clockwise into a down arrow position when activated.
9. What map layers are found in TRANSPORTATION?
Transportation map layers major all major road, rail, transit, and waterway infrastructure in the region.
Some TRANSPORTATION map layers are grouped. The group can be expanded and reveal more layers by clicking on the > symbol which will turn 90 degrees clockwise into a down arrow position when activated.
10. What map layers are found in the PATTERNS tab of the MAP section?
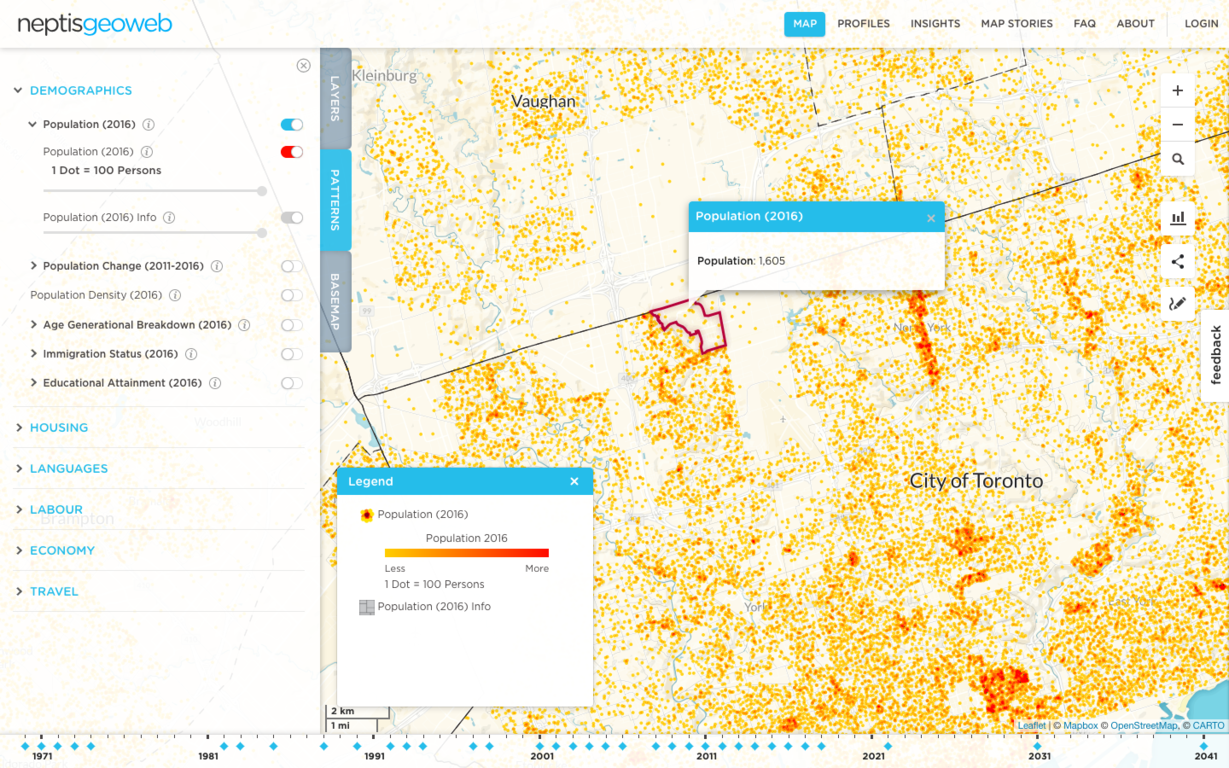
The PATTERNS tab contains over 50 indicators from the Census of Canada and the Transportation Tomorrow Survey (TTS). These layers are organized by themes.
Each indicator has two map layers associated with it, a “stylized” layer and an “info” layer. With the info layer turned on, the census or TTS geographic unit is barely visible. This layer allows retrieval of information for a specific variable.
11. How do I create a map?
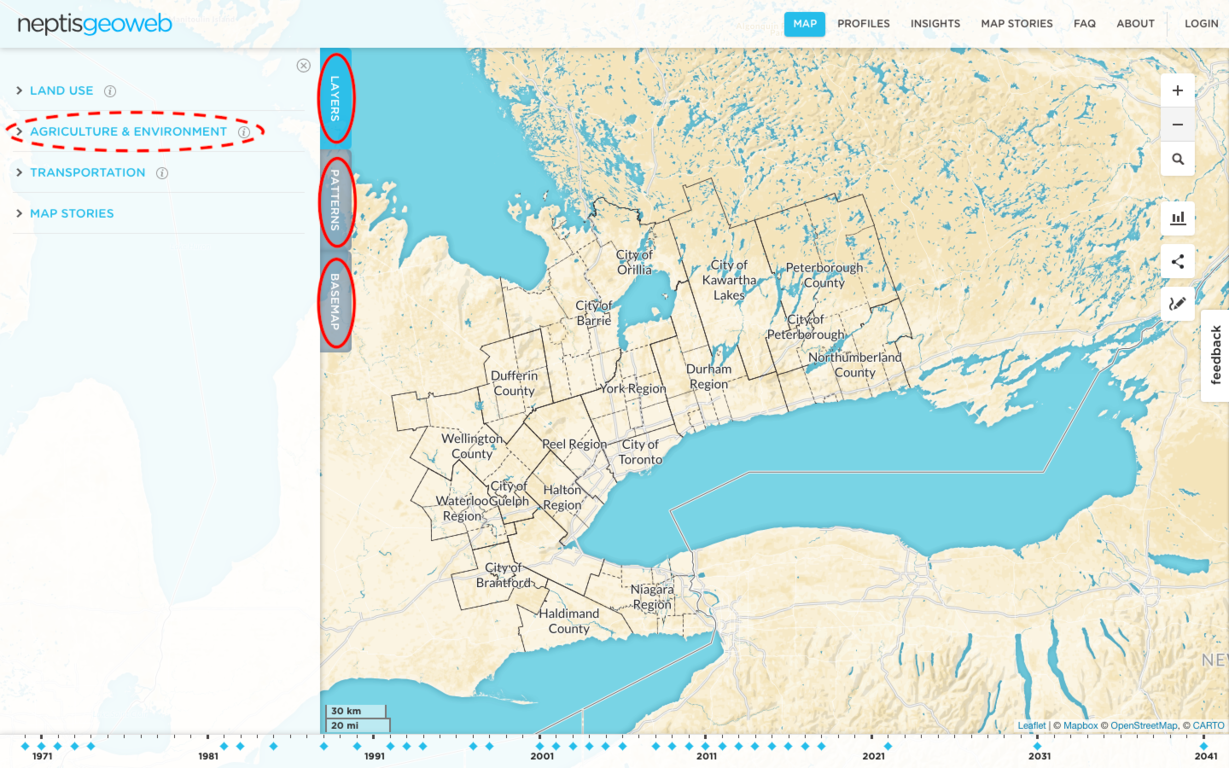
Choose a combination of layers by navigating the tabs (Layers, Patterns, Basemaps) and navigating the themes.
Open the group layers by clicking on the > symbol
Turn on the layer by clicking on the toggle
Use the Transparency slider to see improved the visibility of map layers that overlap
Zoom in and out to different scales on the map using the + and – symbols
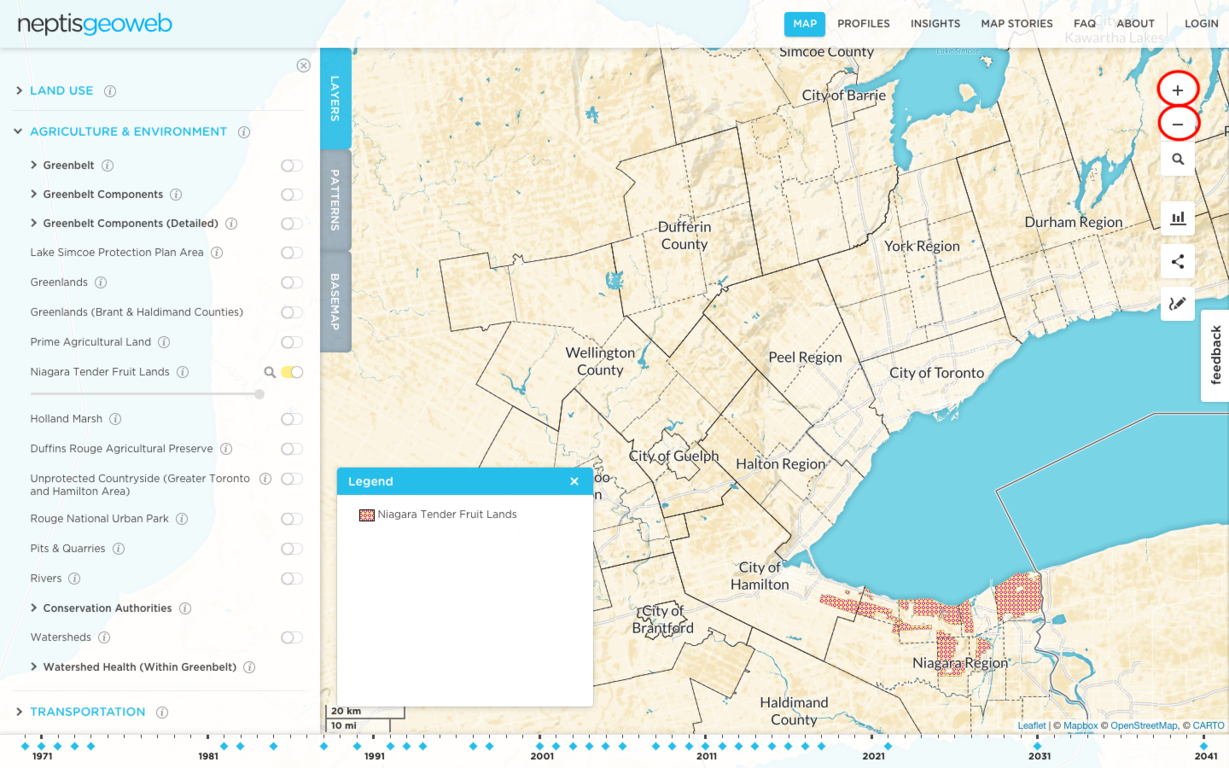
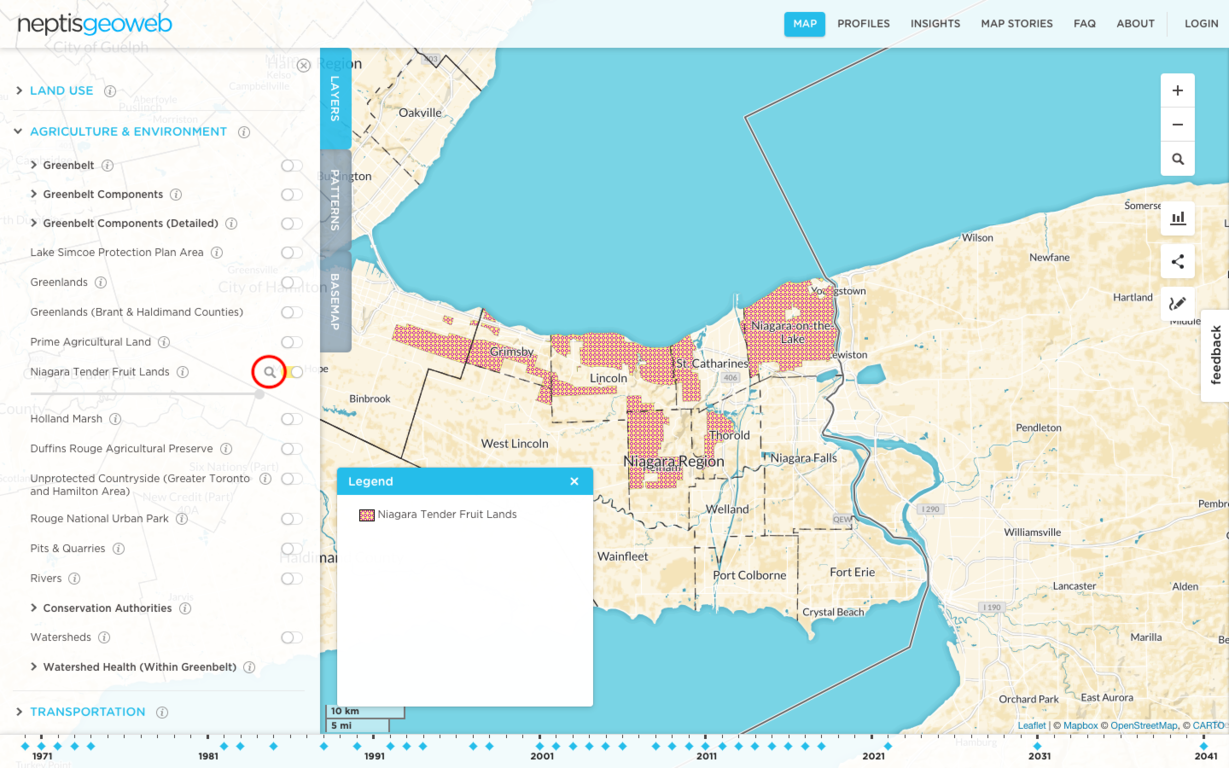
Some layers have a magnifying glass symbol to the right of the layer. By clicking on the symbol, the map will be zoomed to the spatial extent of the layer which might be more localized, for example, the Tender Fruit Lands in Niagara
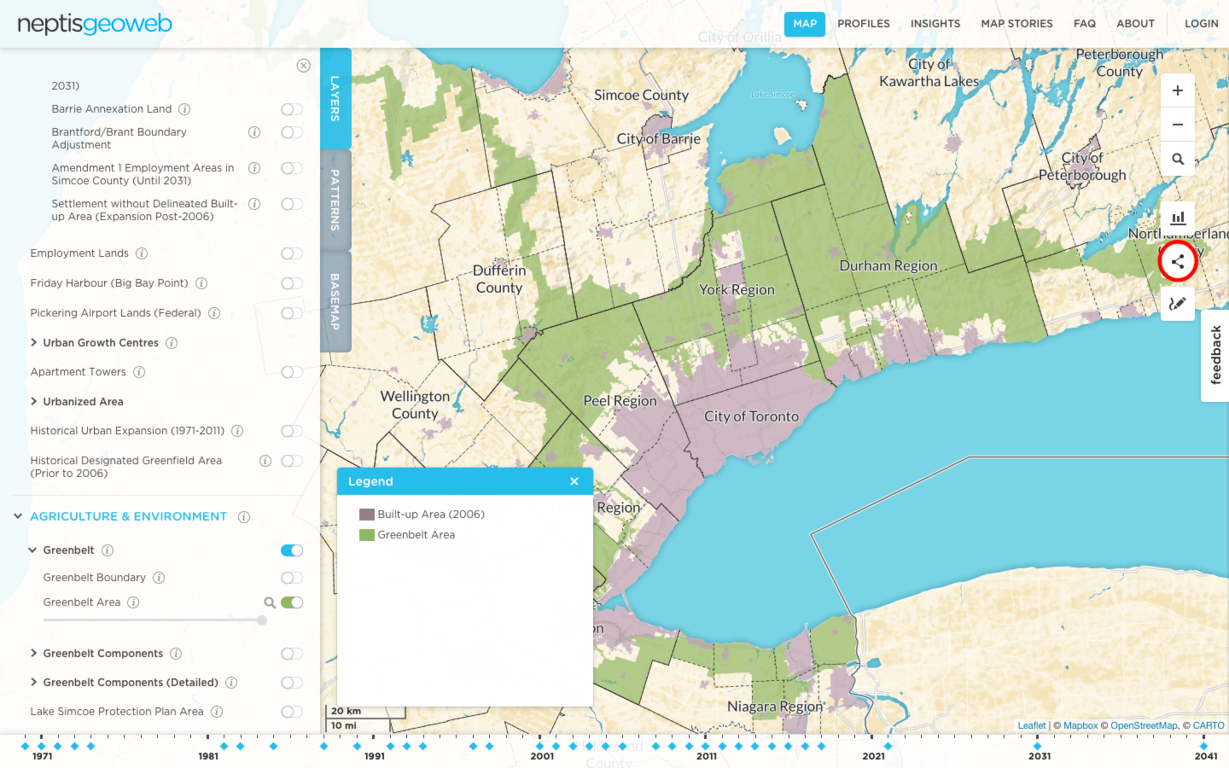
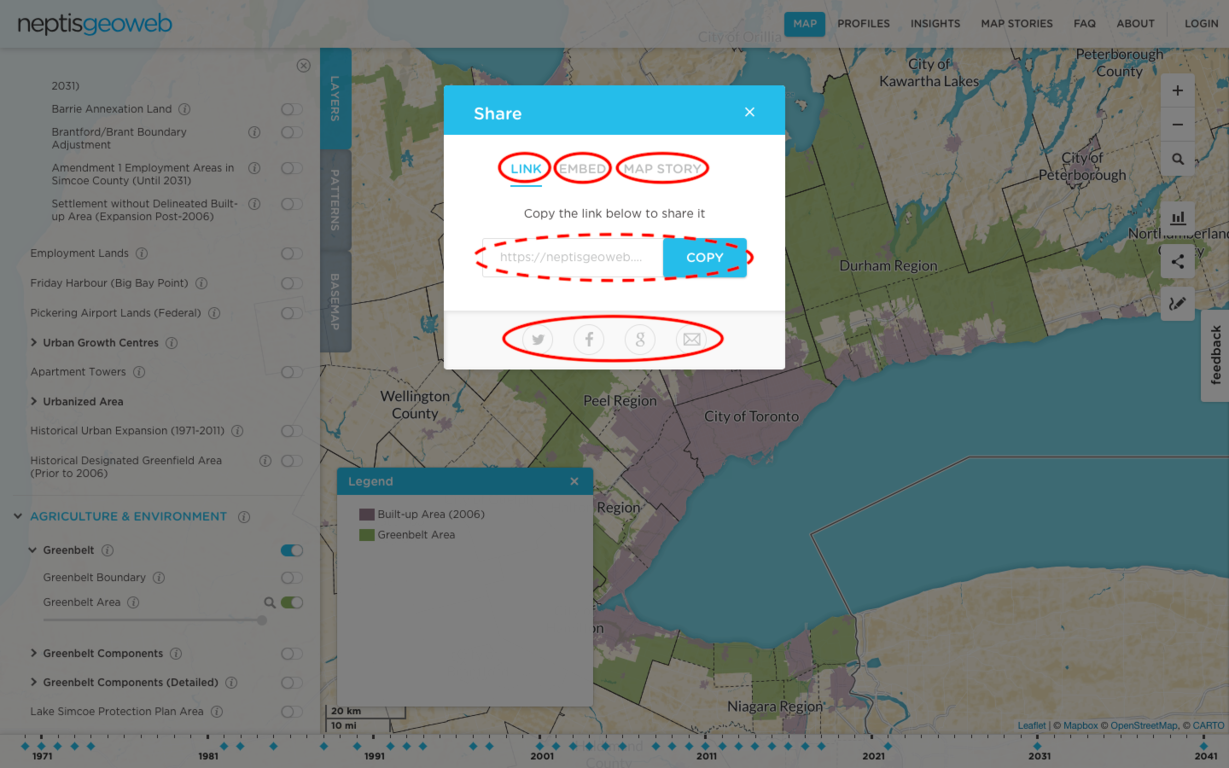
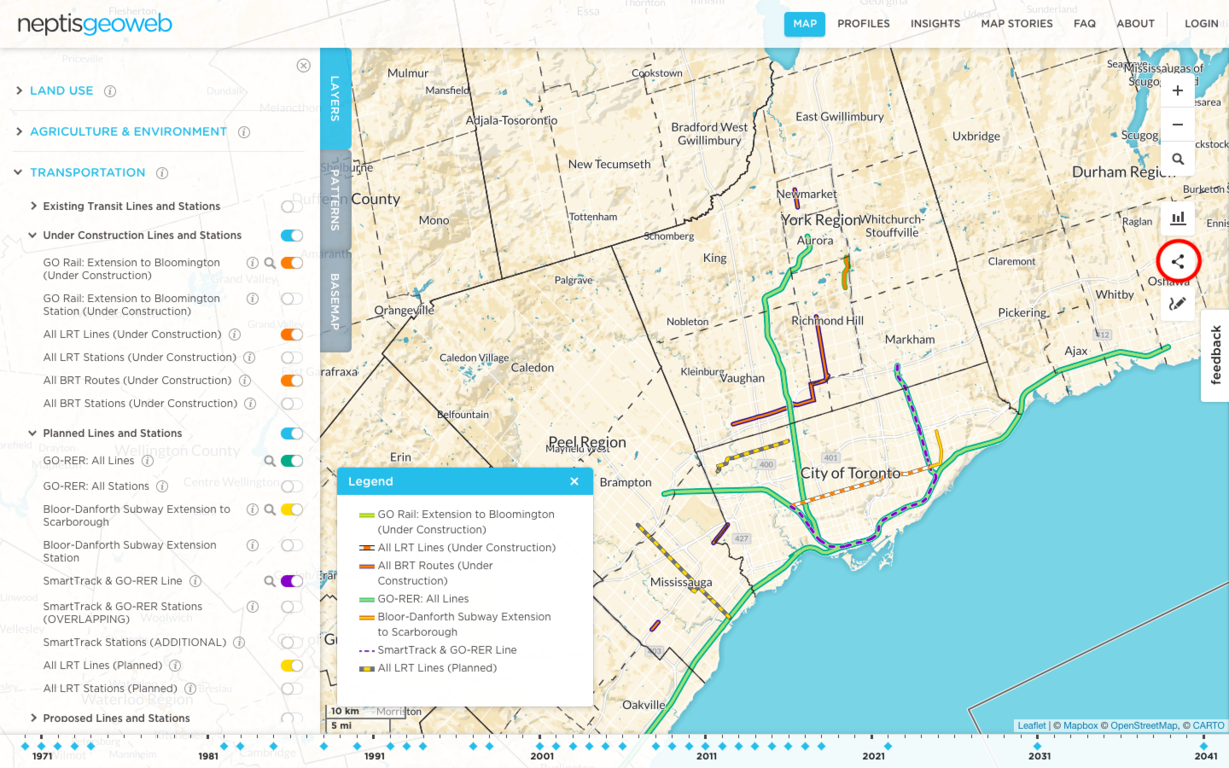
12. How do I share a map?
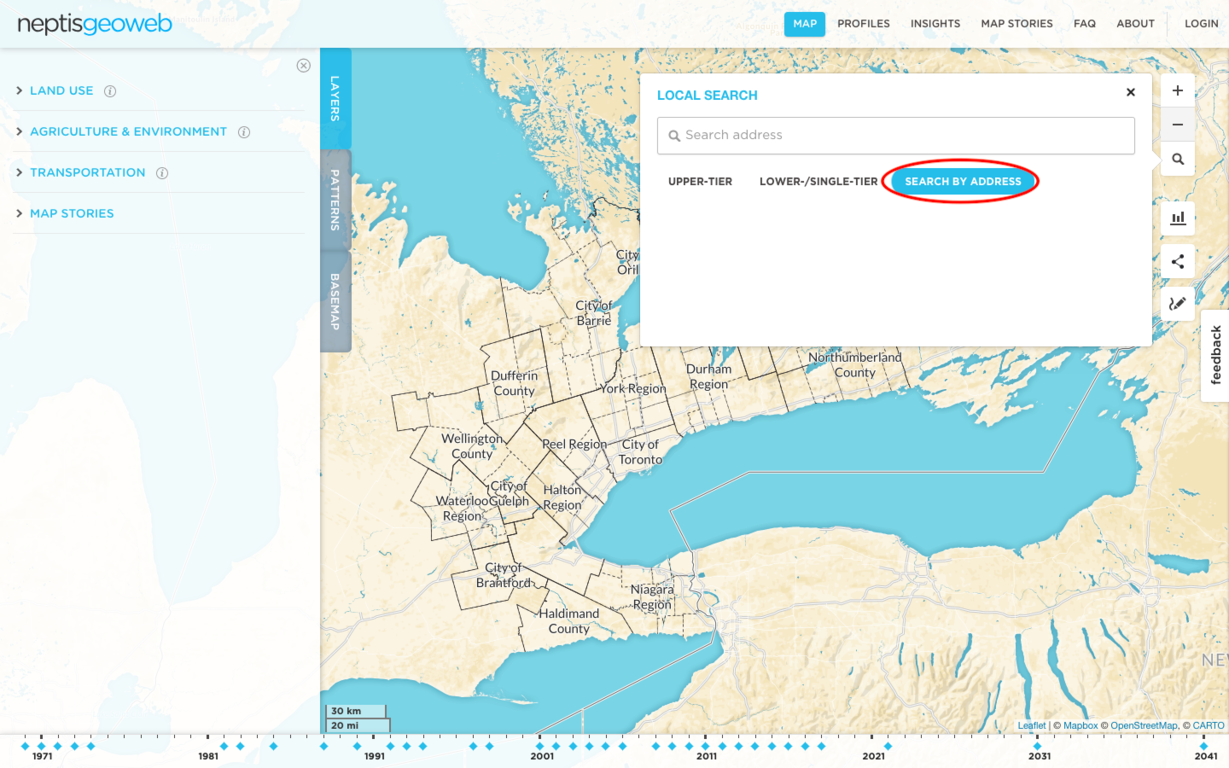
13. How do I search for an address or municipality on the Geoweb?
Open the Local Search box by clicking on the search symbol

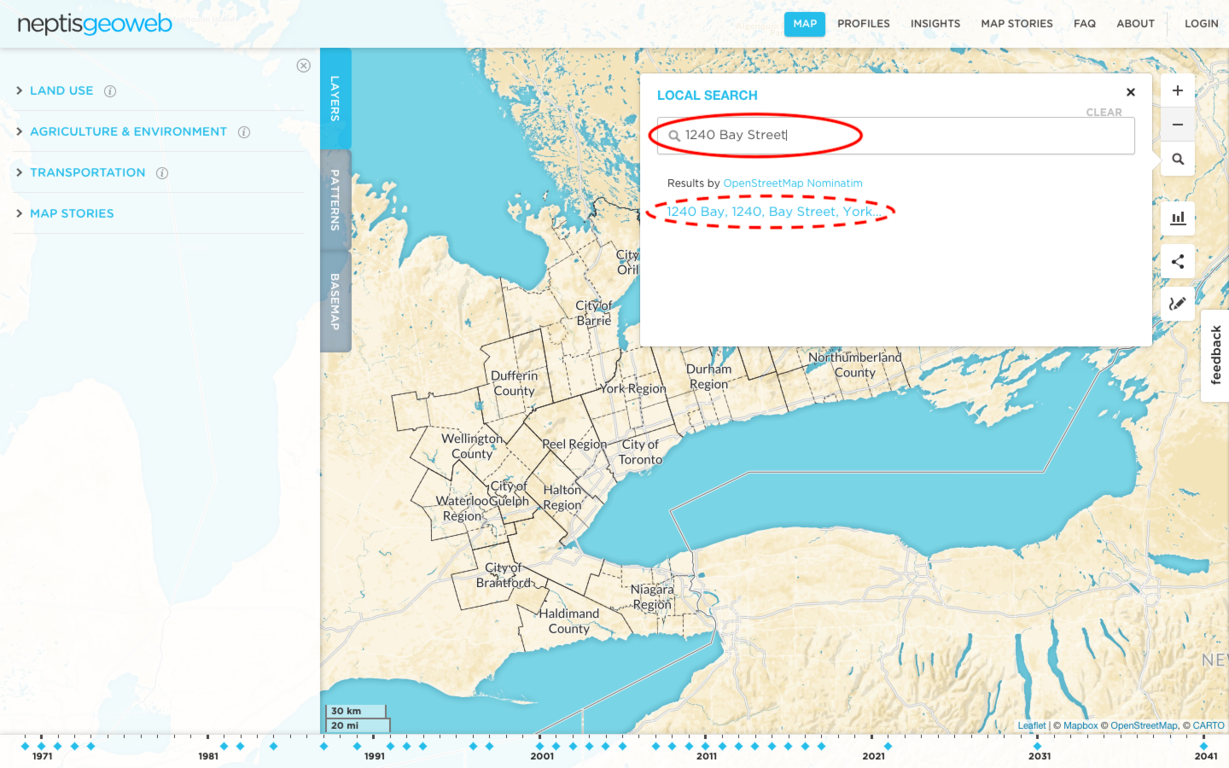
For an Address search, click Search by Address
Enter an address and select the correct address from the list
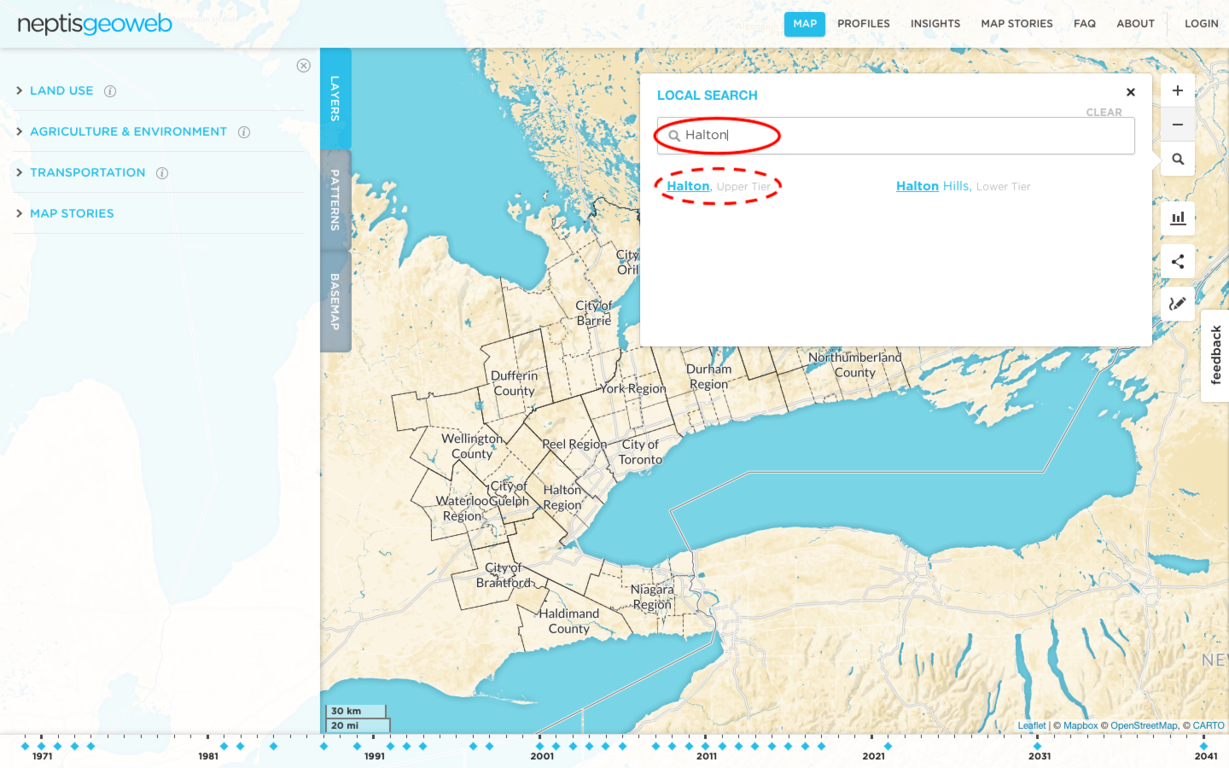
For a Municipality search, choose either Upper-tier or Lower-/Single-Tier municipalities
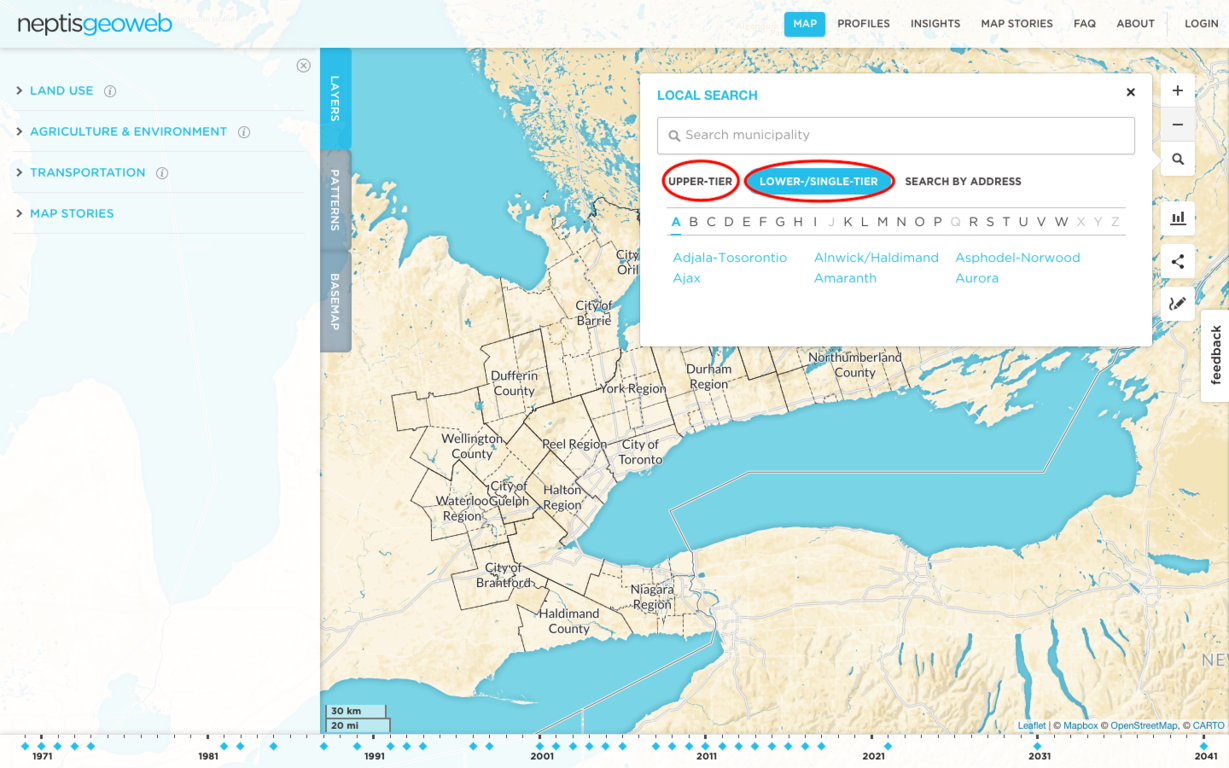
Find and select a municipality using the alphabetical list
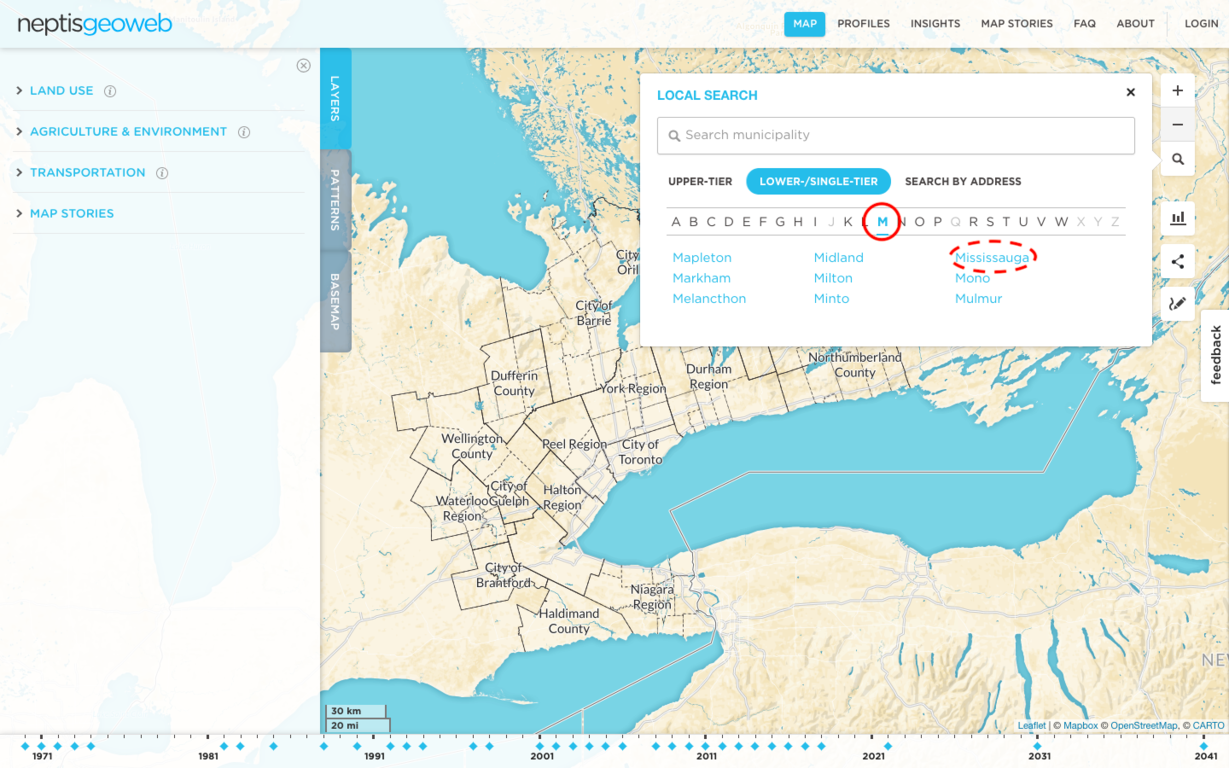
Or search for a municipality using the SEARCH MUNICIPALITY box
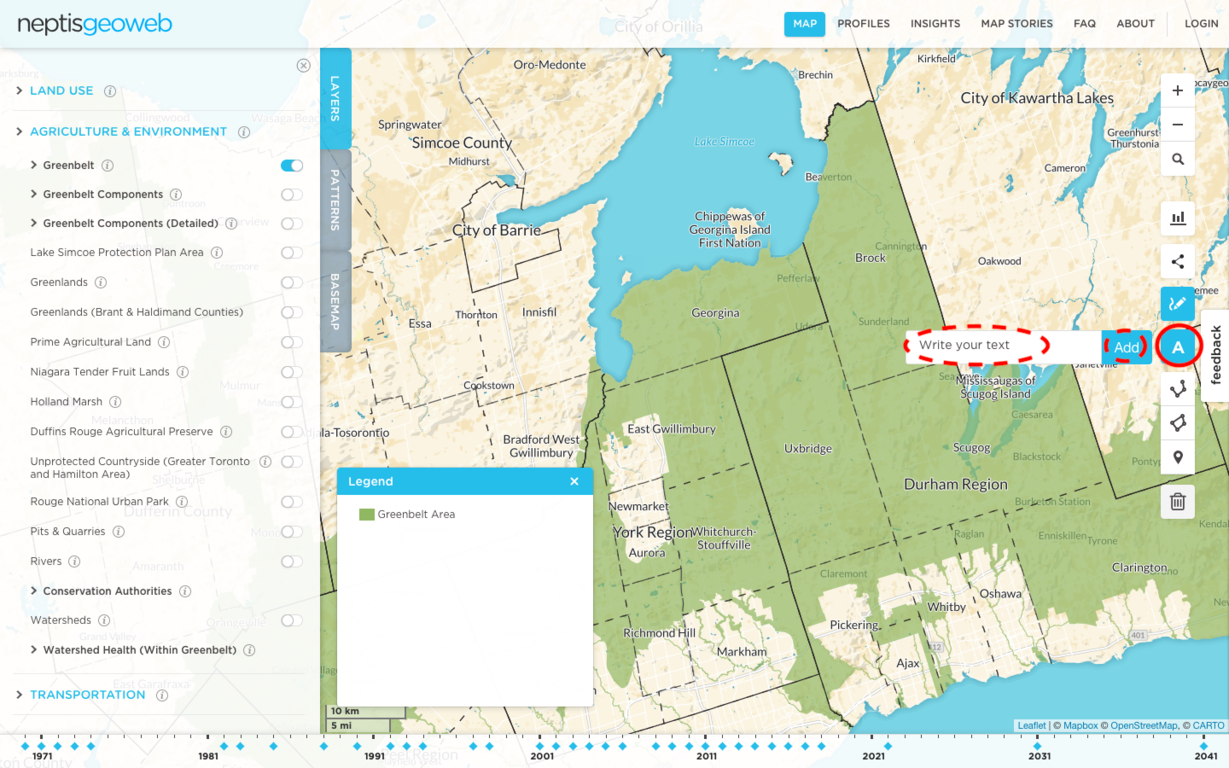
14. How do I mark-up my map with text or draw a line, marker or shape on my map?
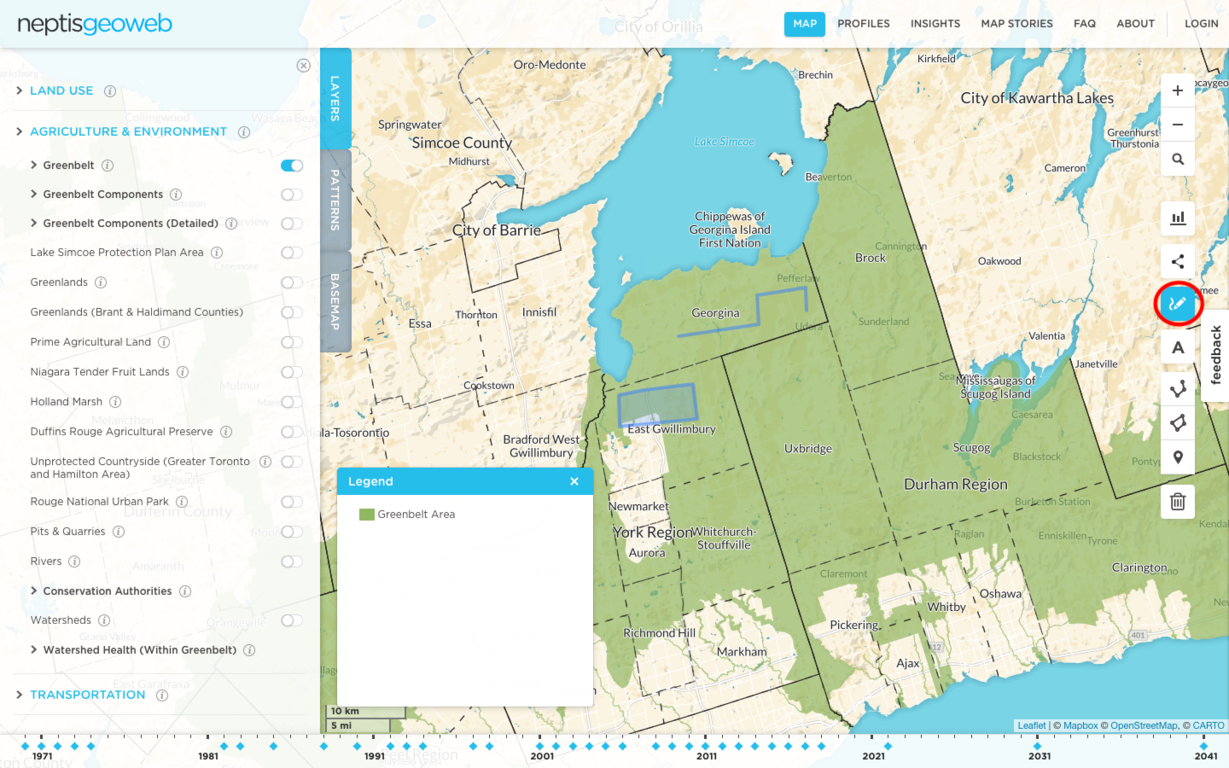
Open the mark-up tools by clicking on the MARK UP THE MAP symbol
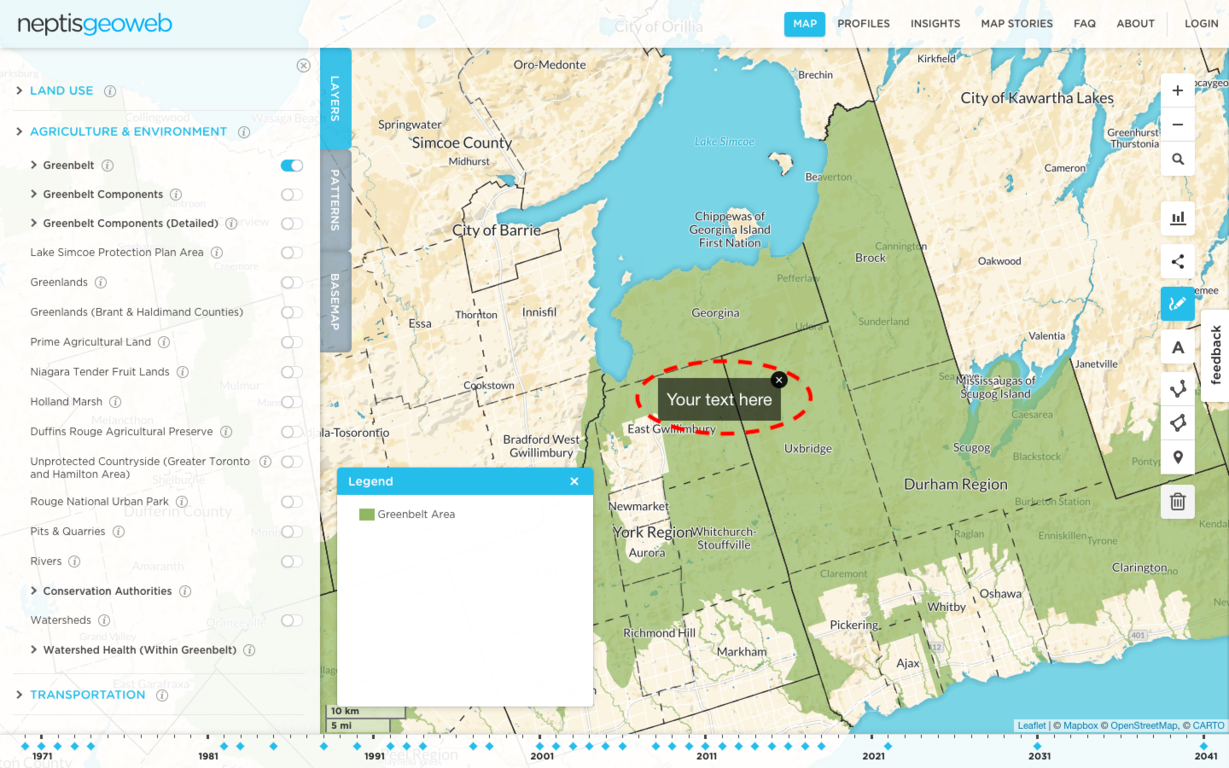
To add text, select the text symbol, enter your text and click ADD
Click and drag the text to move to a desired location or click the X to delete the text
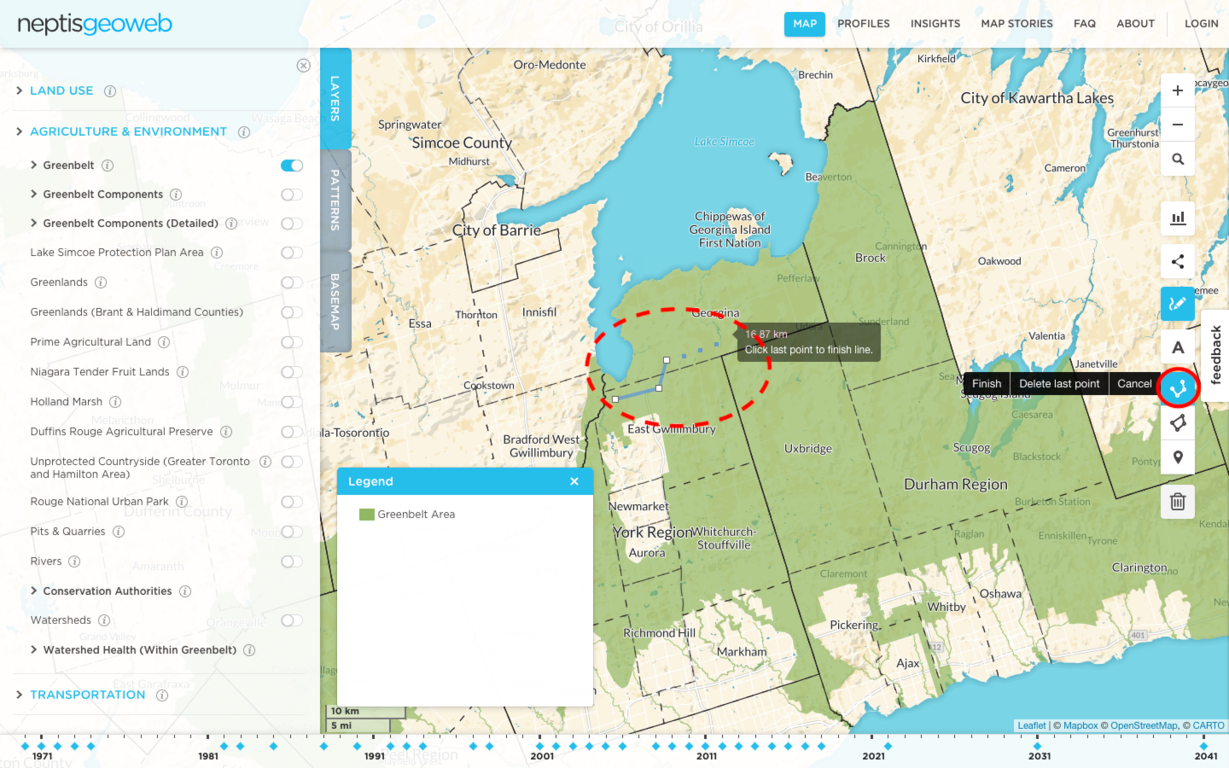
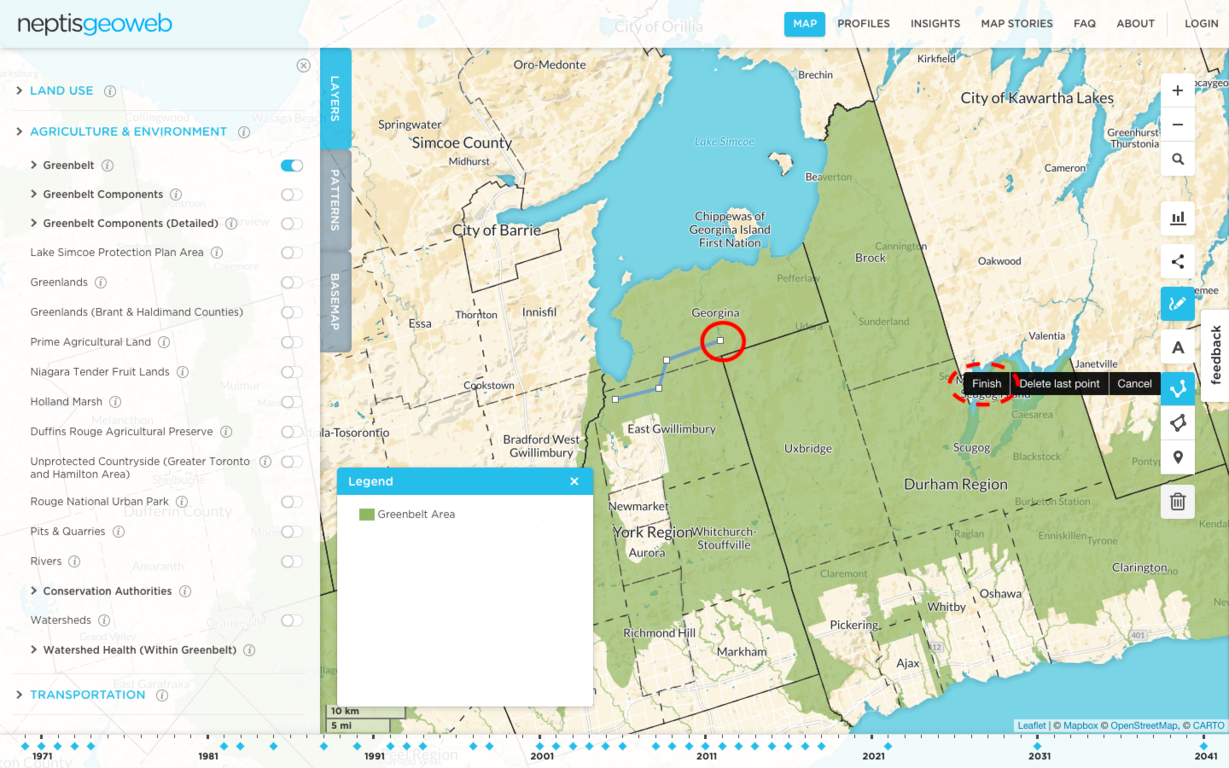
To draw a line, select the LINE tool and begin to draw a line by clicking along the map
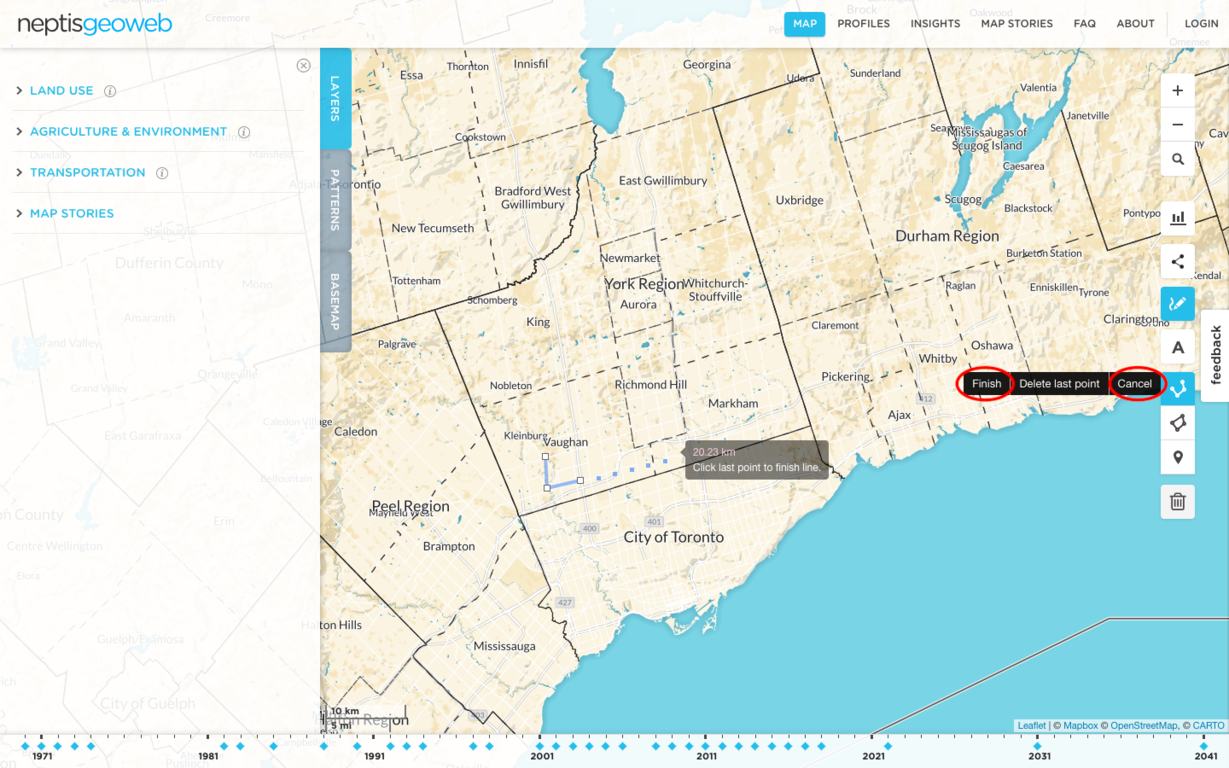
Click on the last point to complete the line or click FINISH
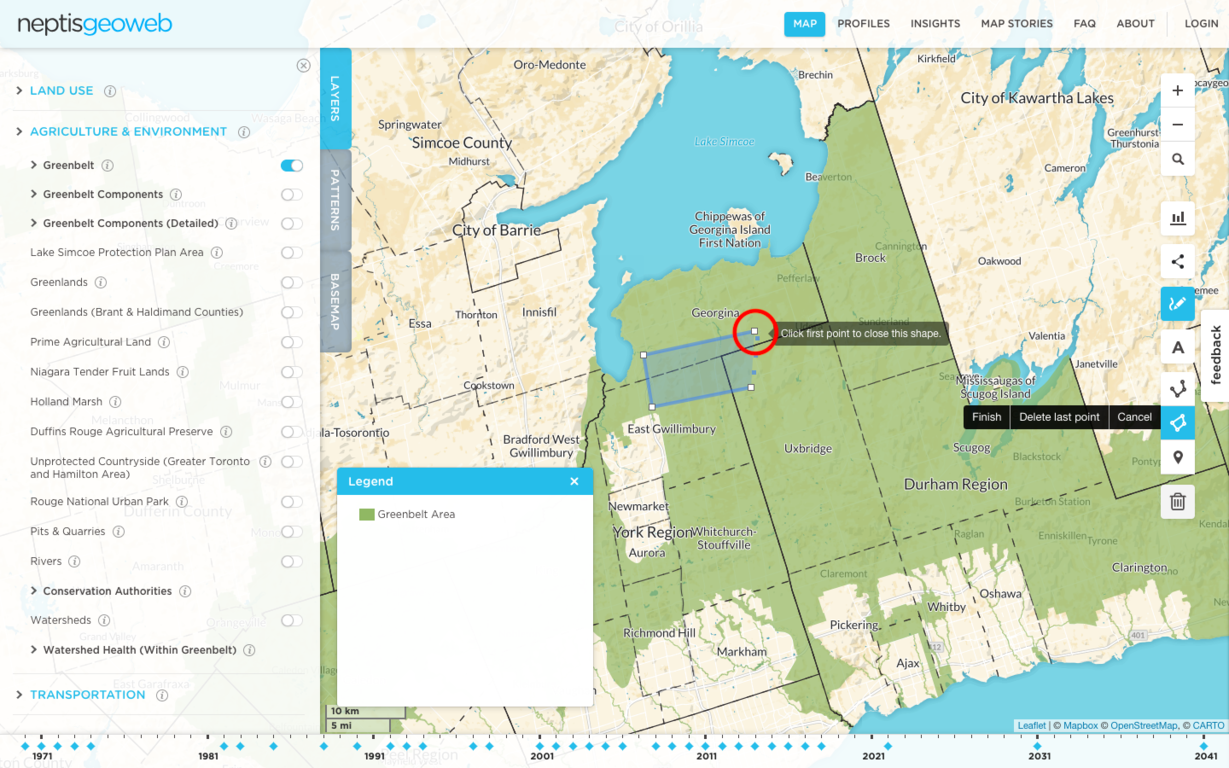
To draw a shape, select the POLYGON tool and begin to draw a shape by clicking on the map
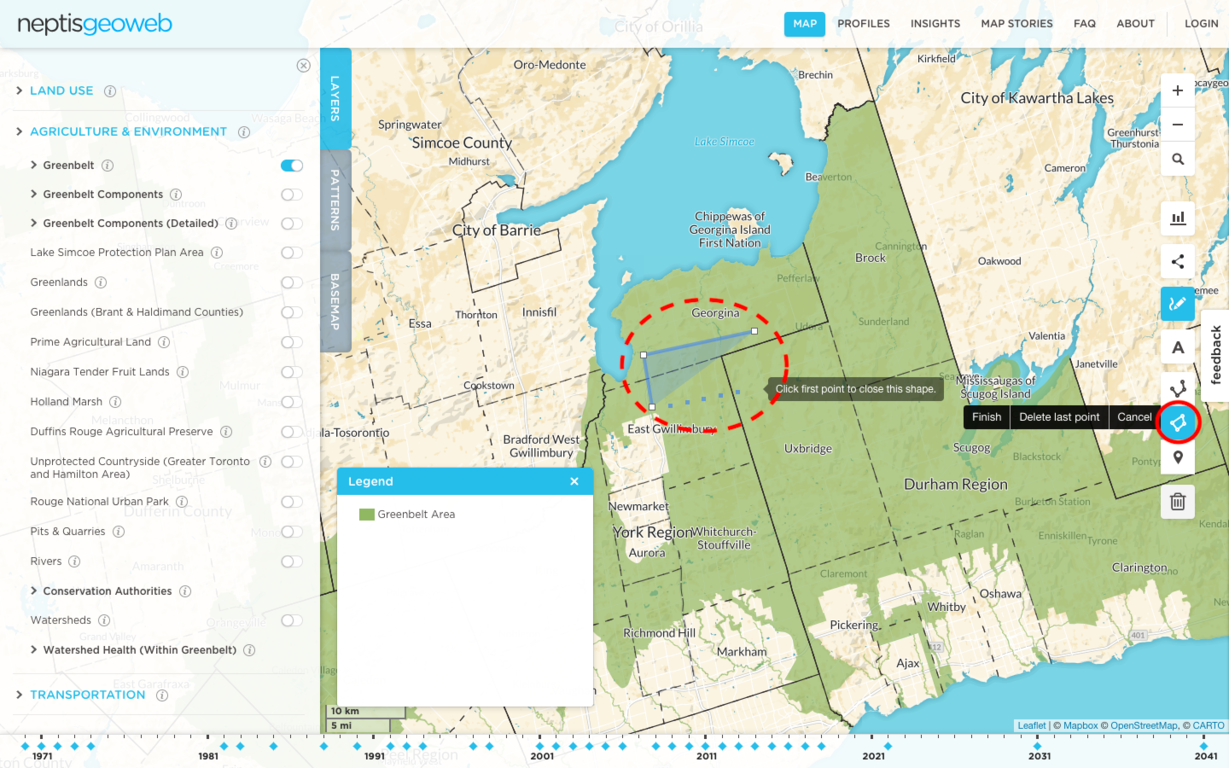
Click on the first point to complete the shape
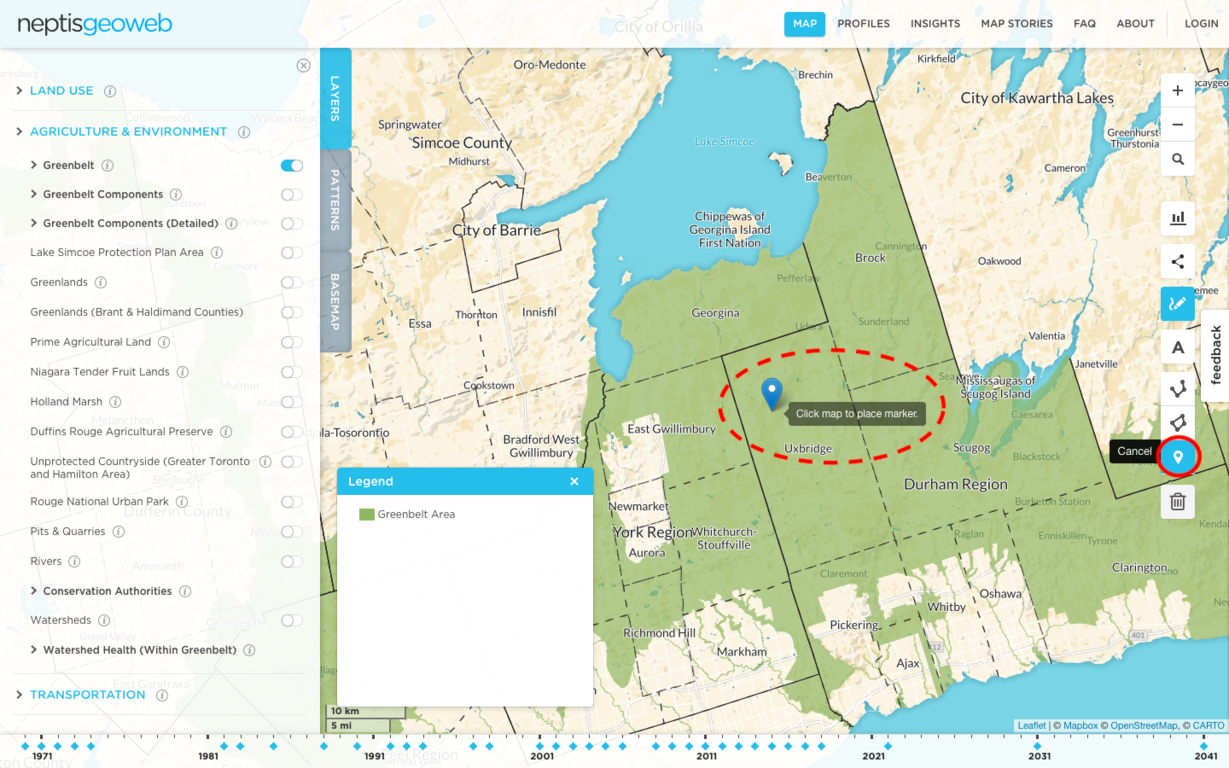
To drop a marker (point), select the MARKER tool and click on a desired location to place the marker on the map
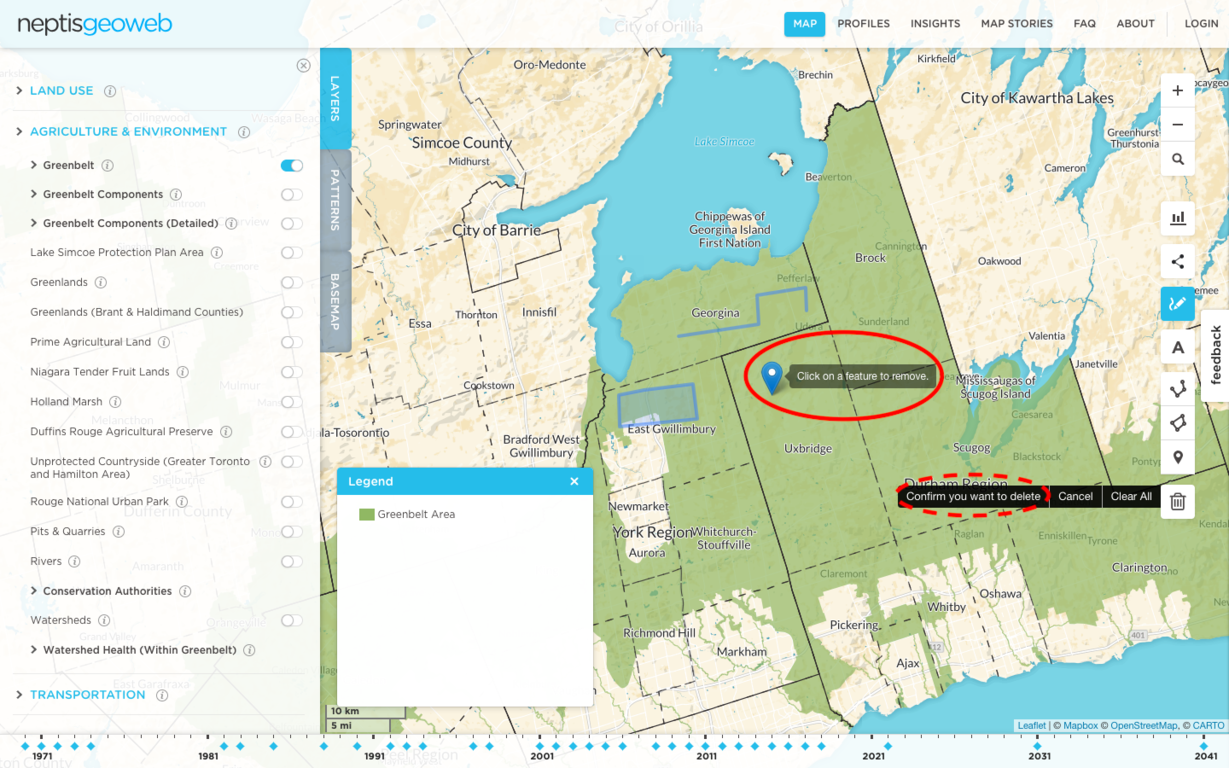
To delete a mark-up (line, shape or marker), click the TRASH CAN symbol
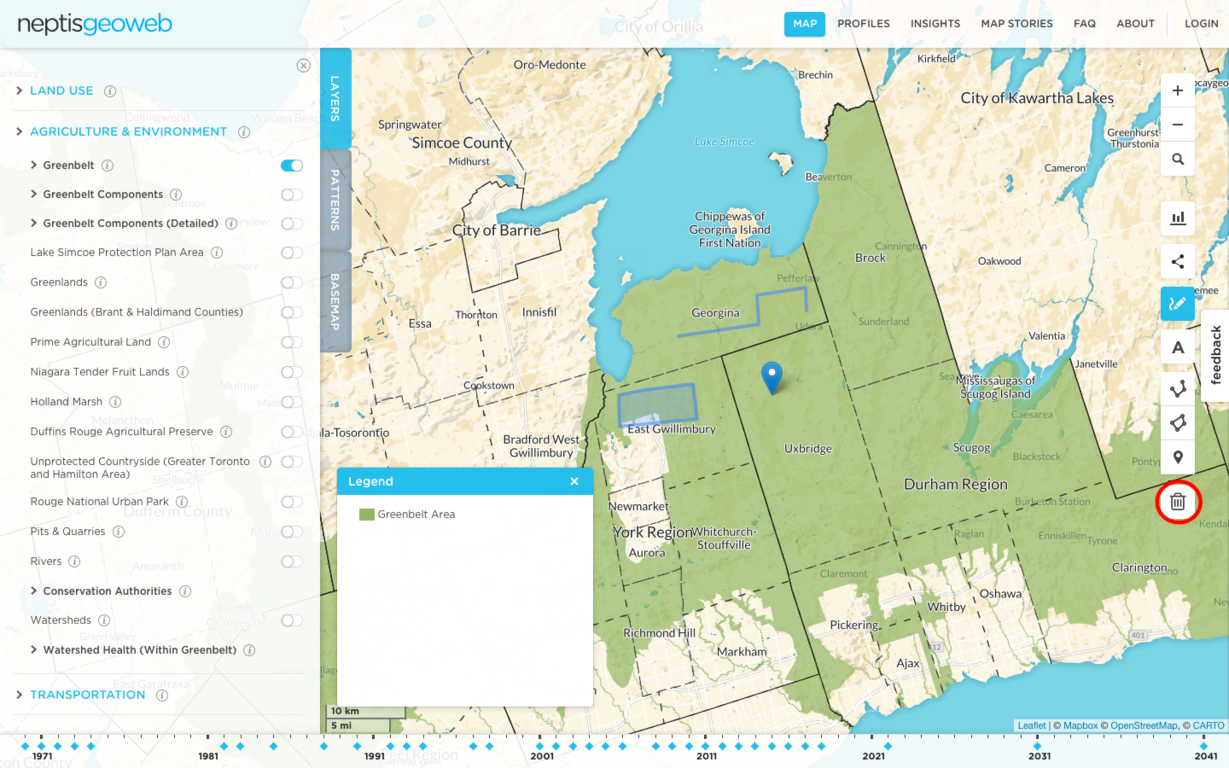
Select on the mark-up(s) you want to delete and click CONFIRM YOU WANT TO DELETE
To complete all mark-up, click on the MARK UP THE MAP symbol
15. How do I measure distance on the map?
Open the mark-up tools by clicking on the MARK UP THE MAP symbol

Select the Line tool and begin to draw a line by clicking along the map. Distance will be measured as you draw.
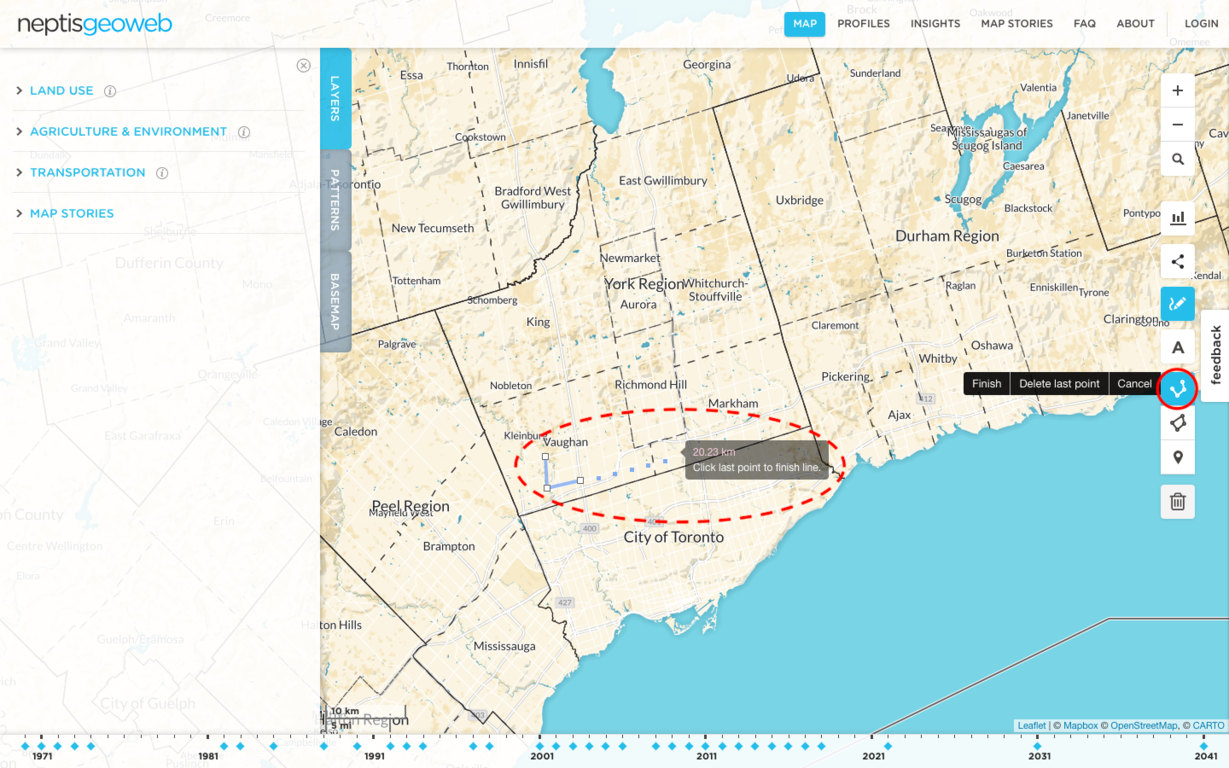
To stop measuring, click FINISH to save the line or CANCEL to delete the line
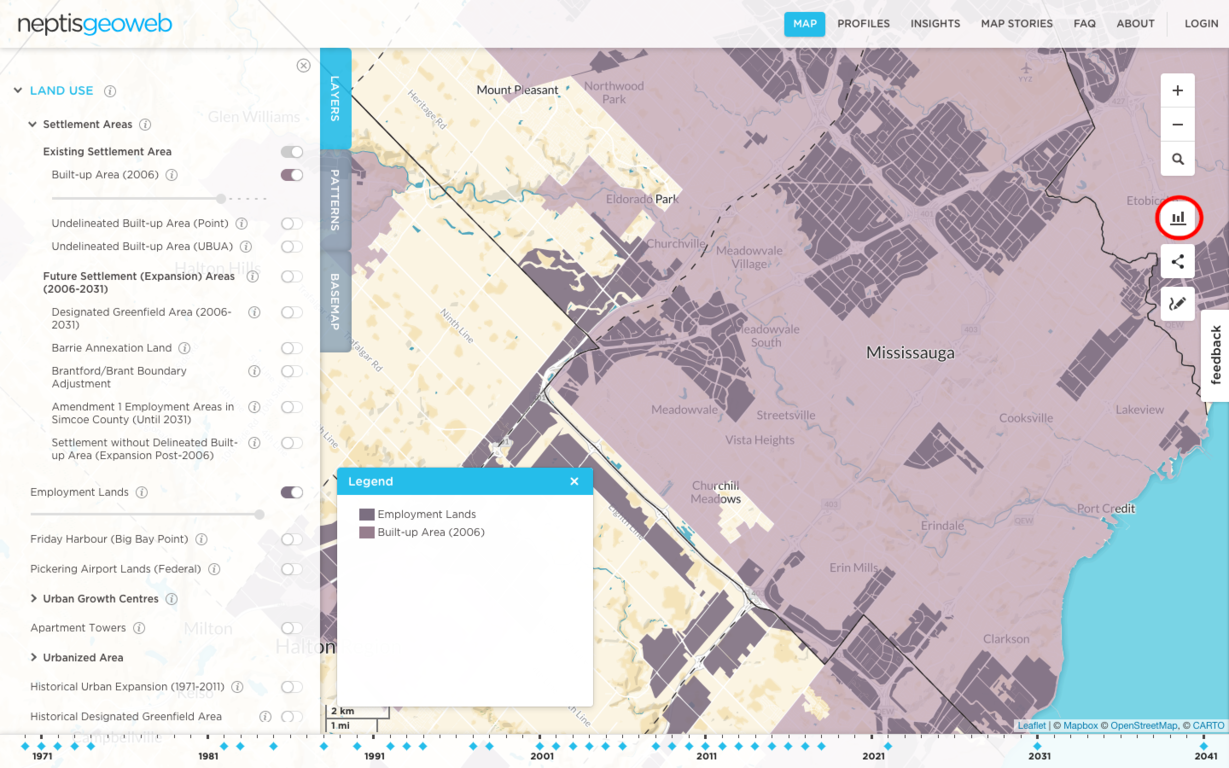
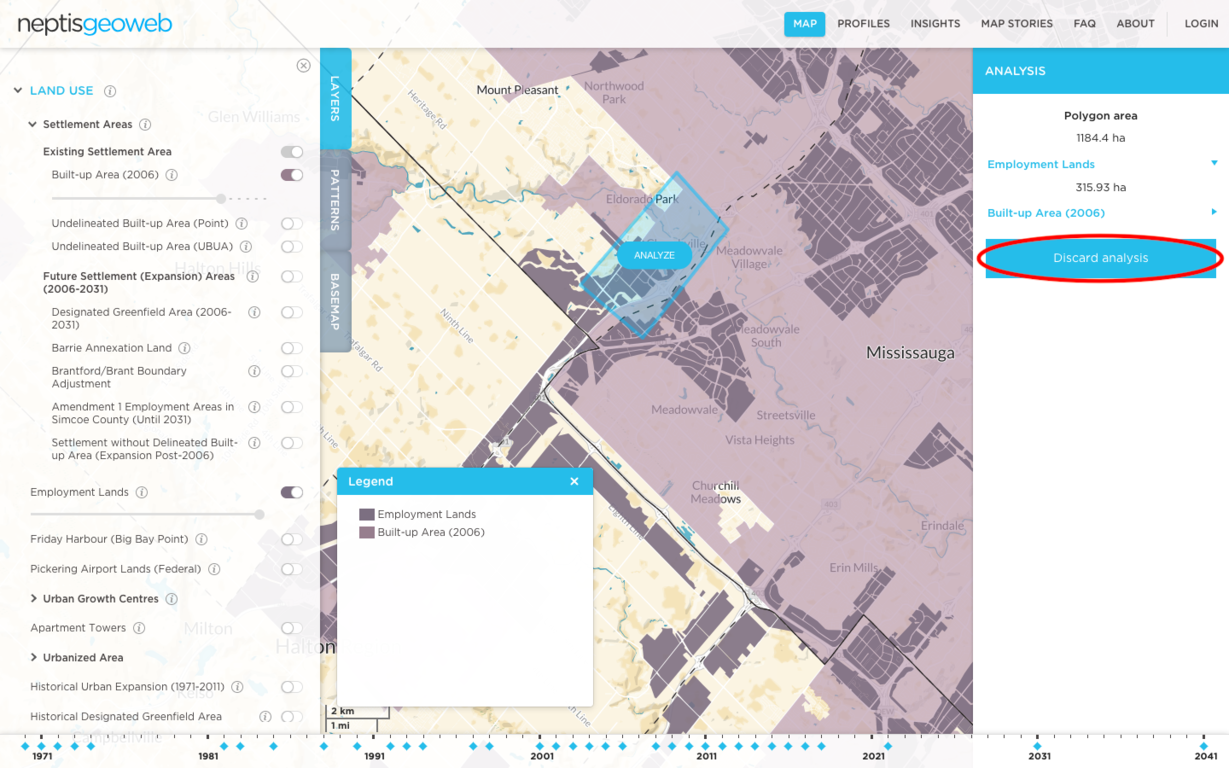
16. How do I measure area on the map?
Click on the MEASURE AREA button
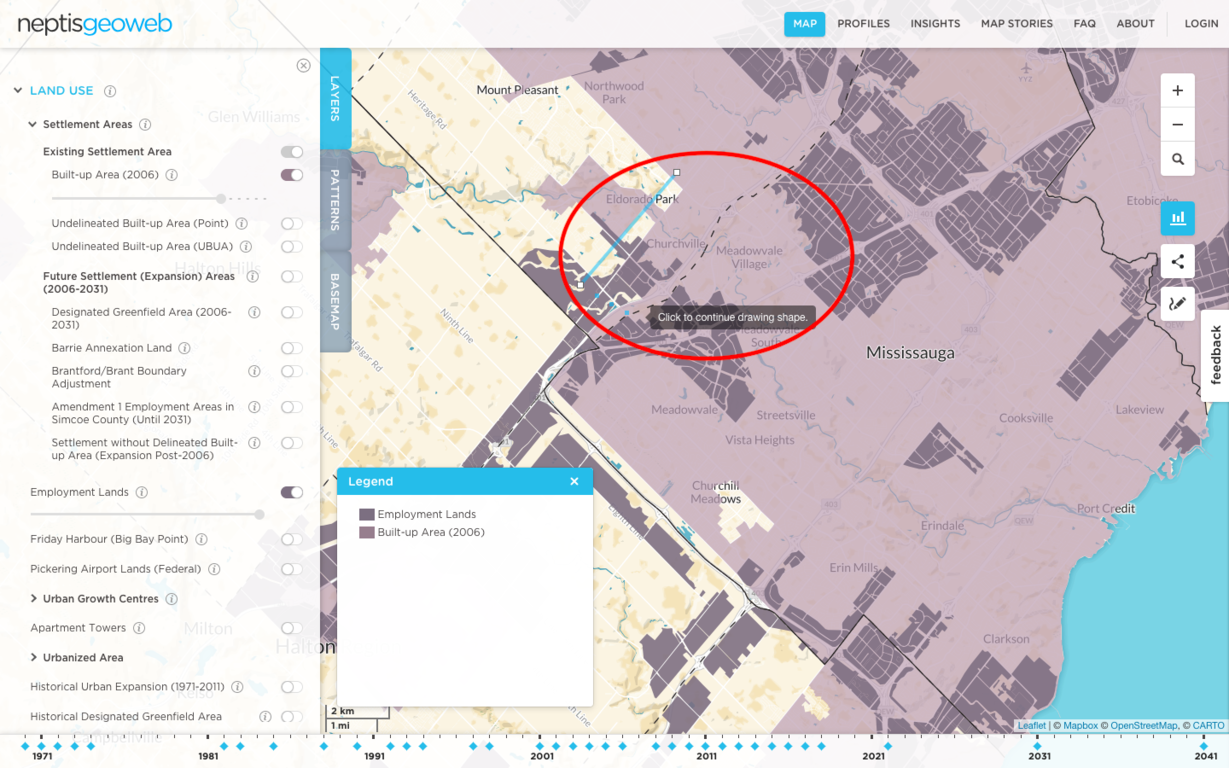
Draw a shape by clicking on the map
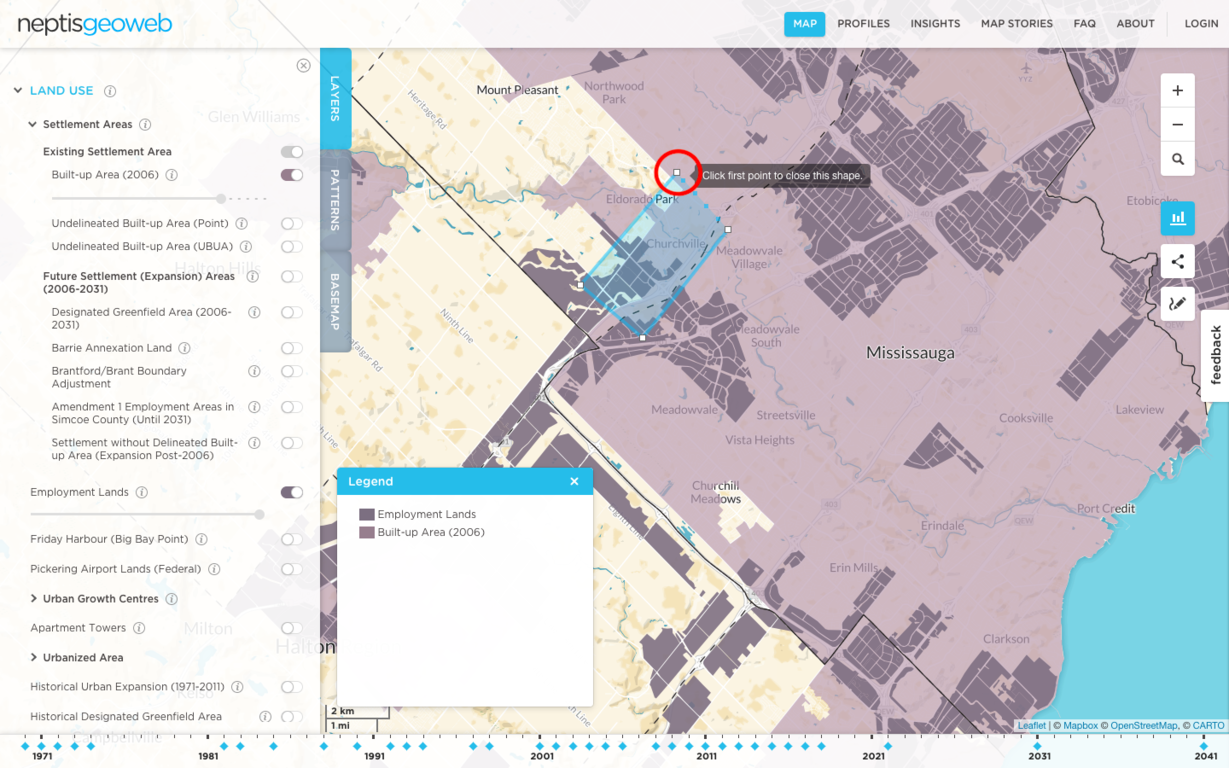
To complete the shape, click on the first point or double click on the last point
Click ANALYZE to measure the area of the shape drawn and map layers within the shape
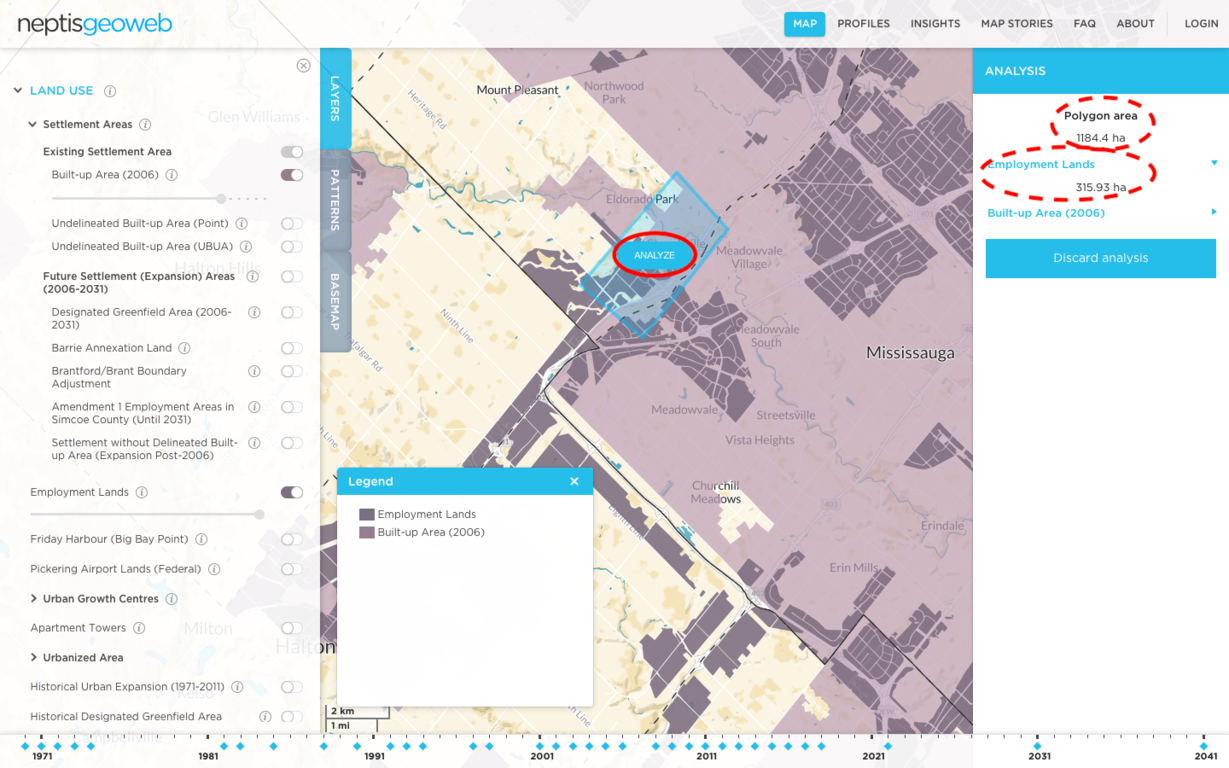
Click DISCARD ANALYSIS to stop measuring
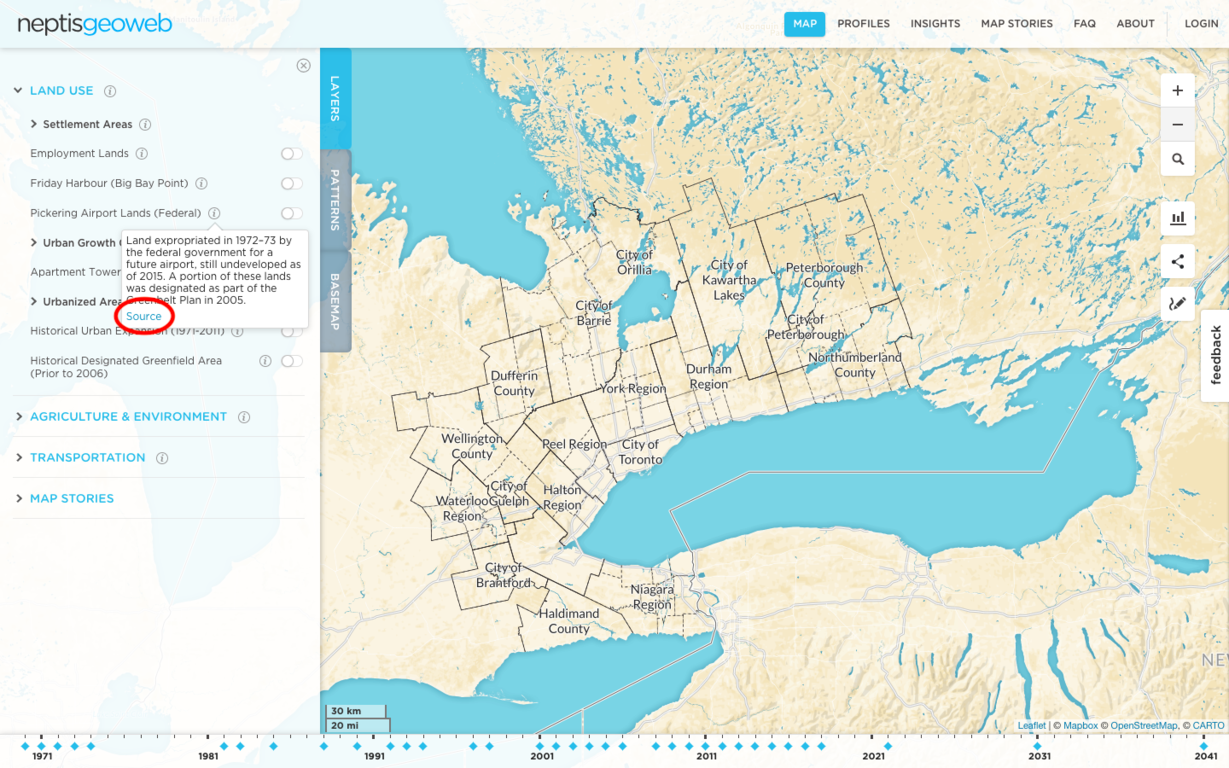
17. How do I find out more information on the source of a map layer or a description of a data set?
Hover over the i symbol beside a layer or group to see a short description
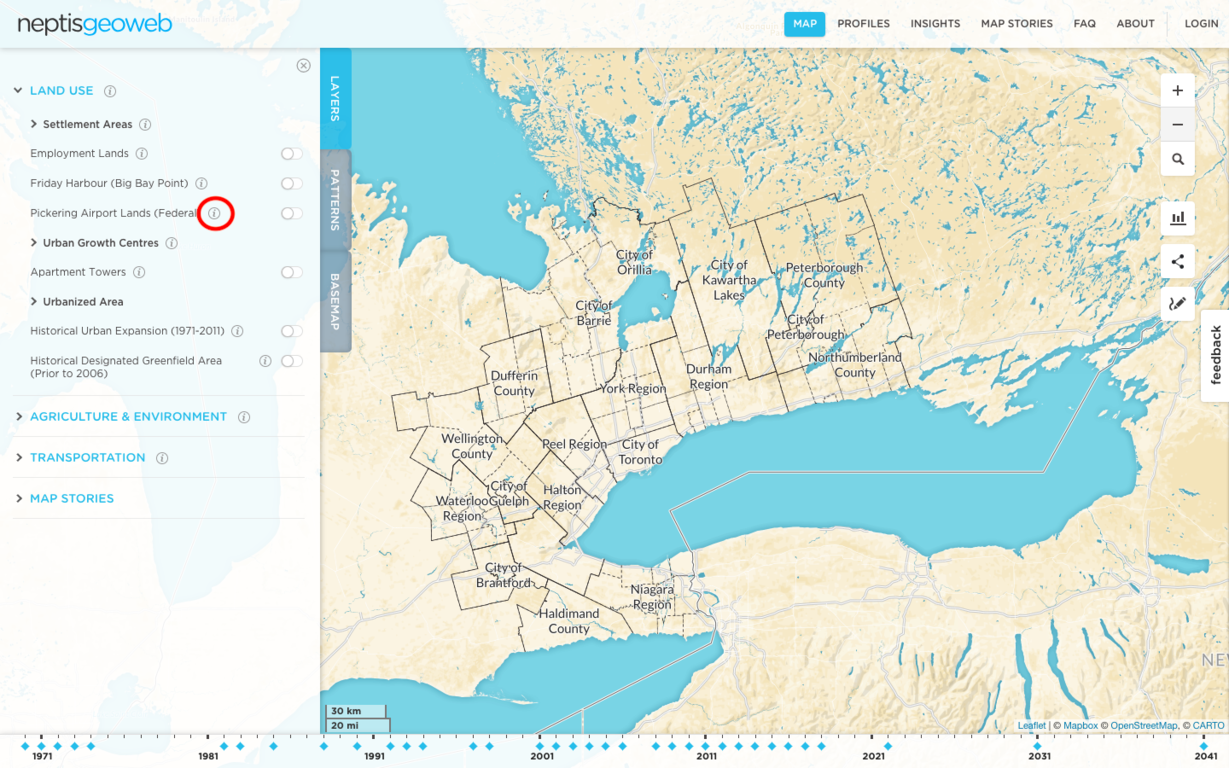
Click on SOURCE to view a more detailed description
18. How can I contribute a map to the MAP STORIES section of the Geoweb?
Once you have created a map, click the Share symbol
Select MAP STORY and CLICK HERE TO BEGIN
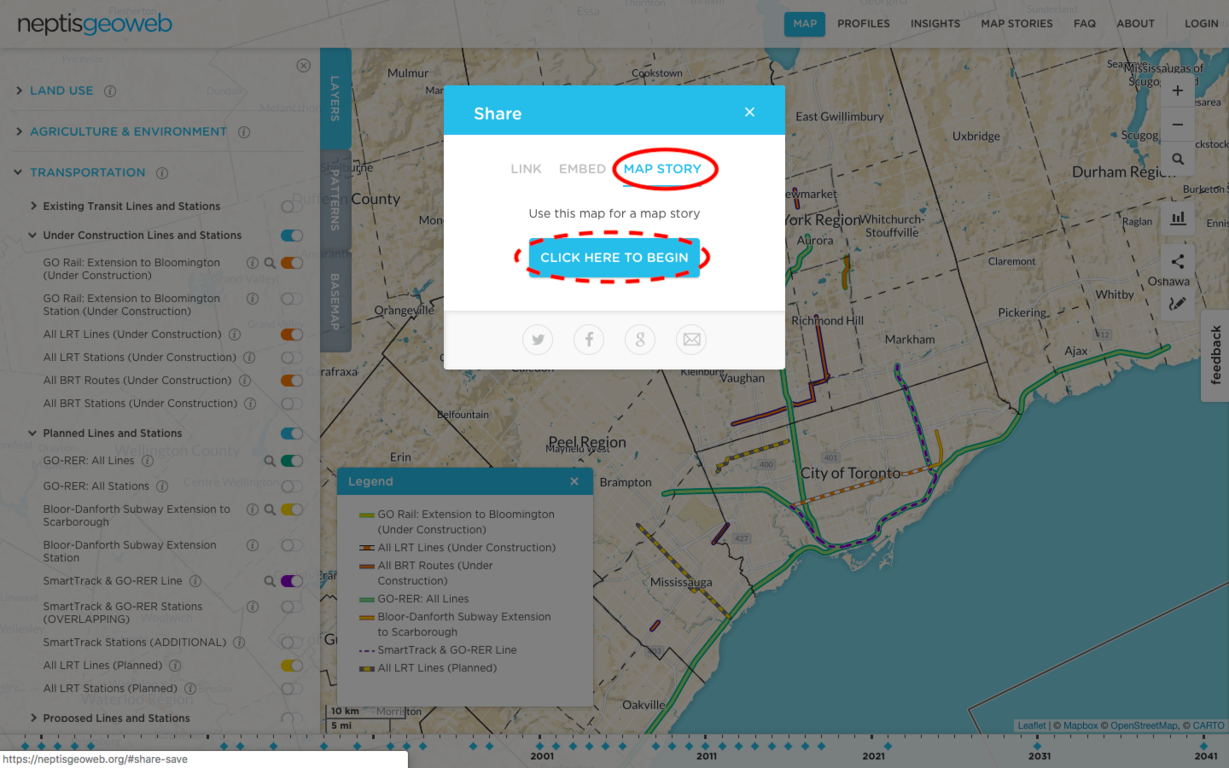
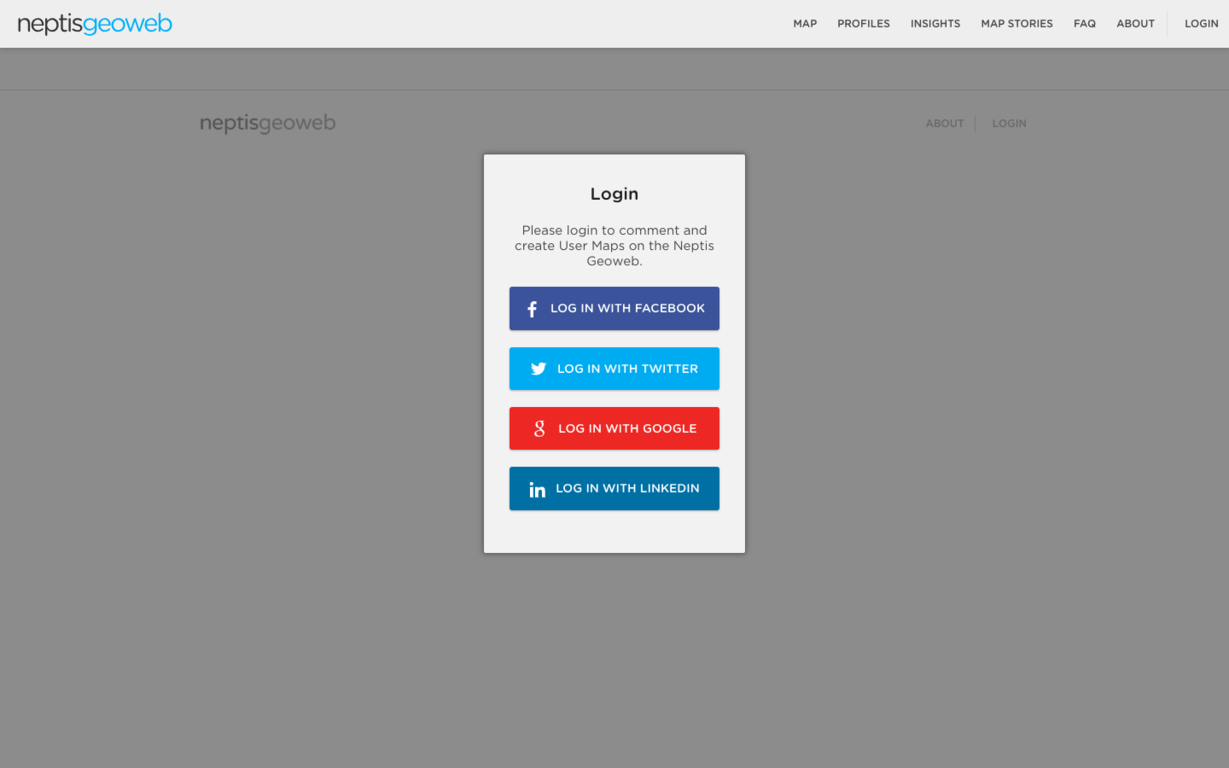
If you are not logged in to the Geoweb, you will be prompted to log in with a social media account
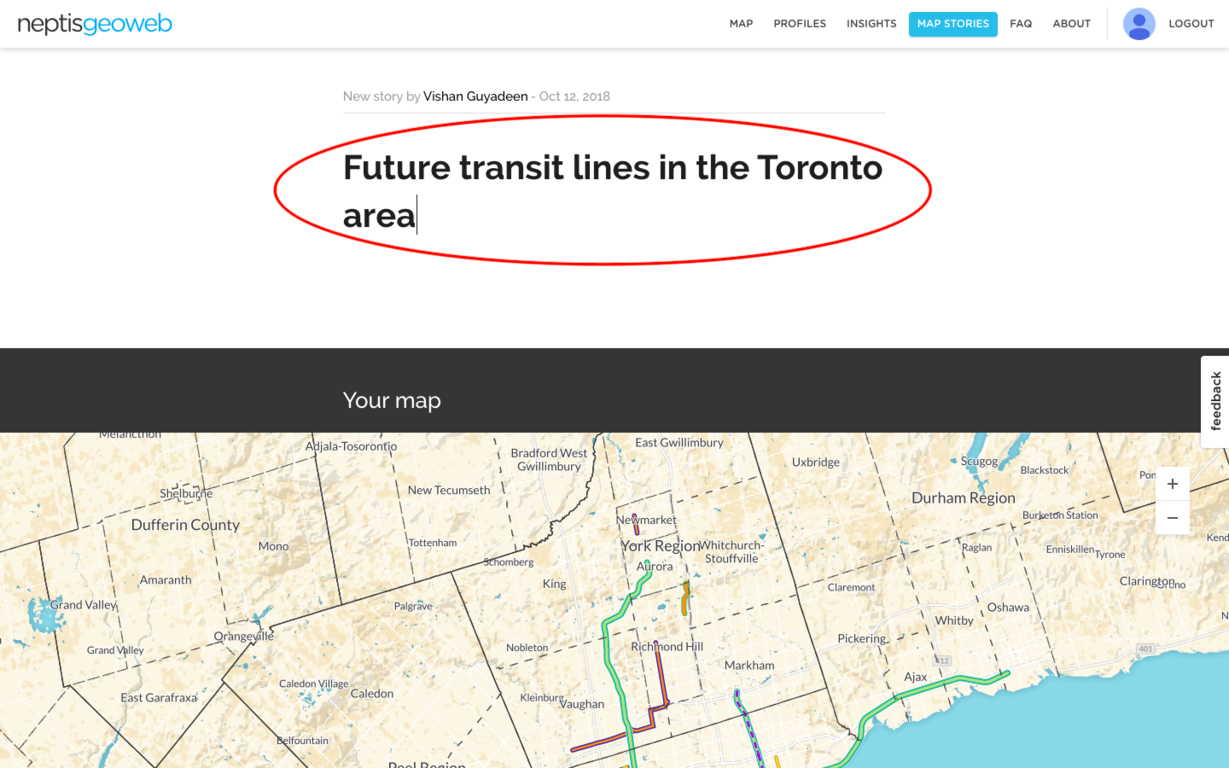
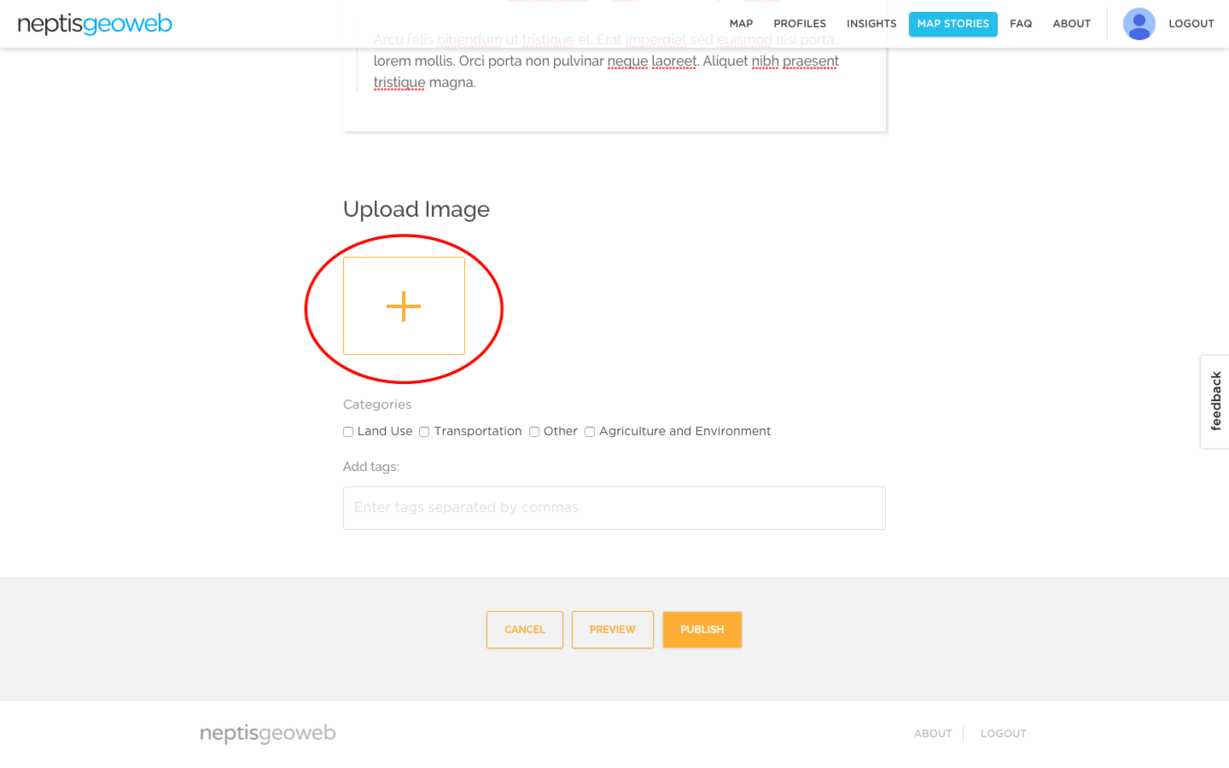
Complete the Map Story form by entering a title, and text for your story
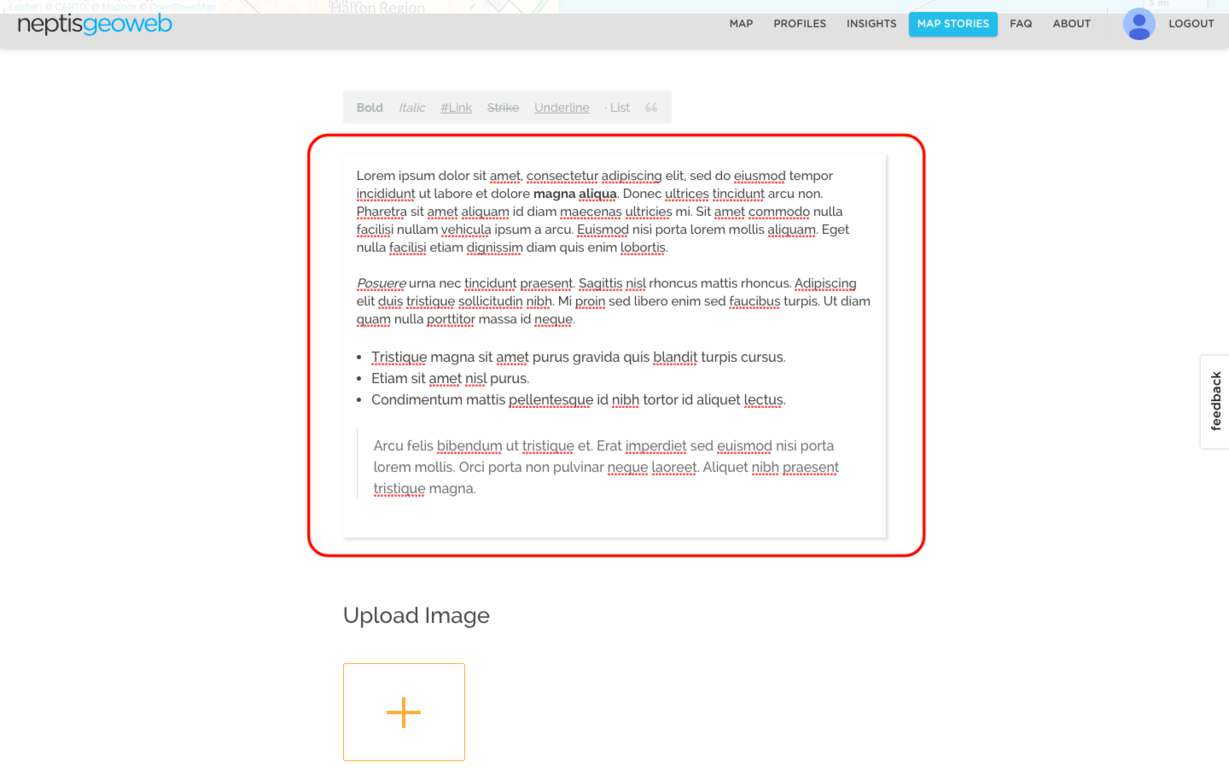
Select an image from your computer to accompany your map story by clicking on the + symbol. This image will also be the thumbnail for your map story
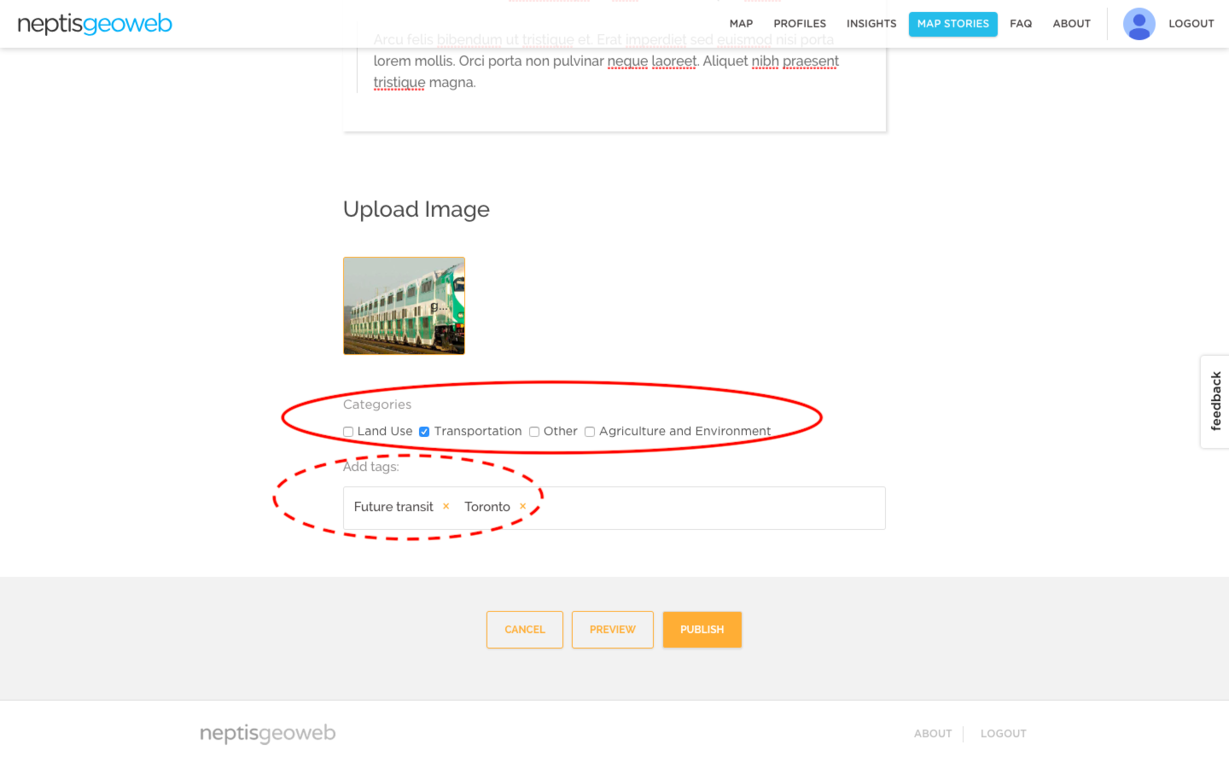
Select relevant categories and enter tags to make your story easy to find by other users. Multiple tags are separated using comma (,)
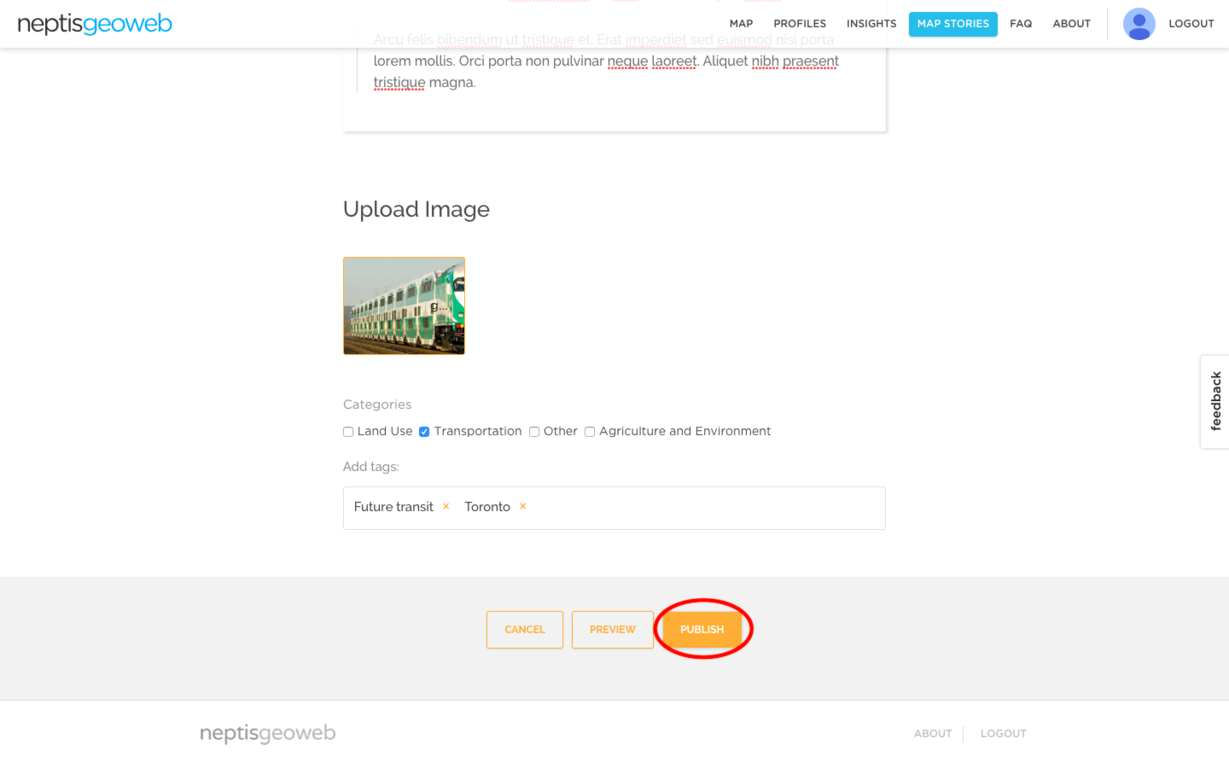
Click PUBLISH to post your map story
19. Where can I find an overview of the main tools and functions of the map section?
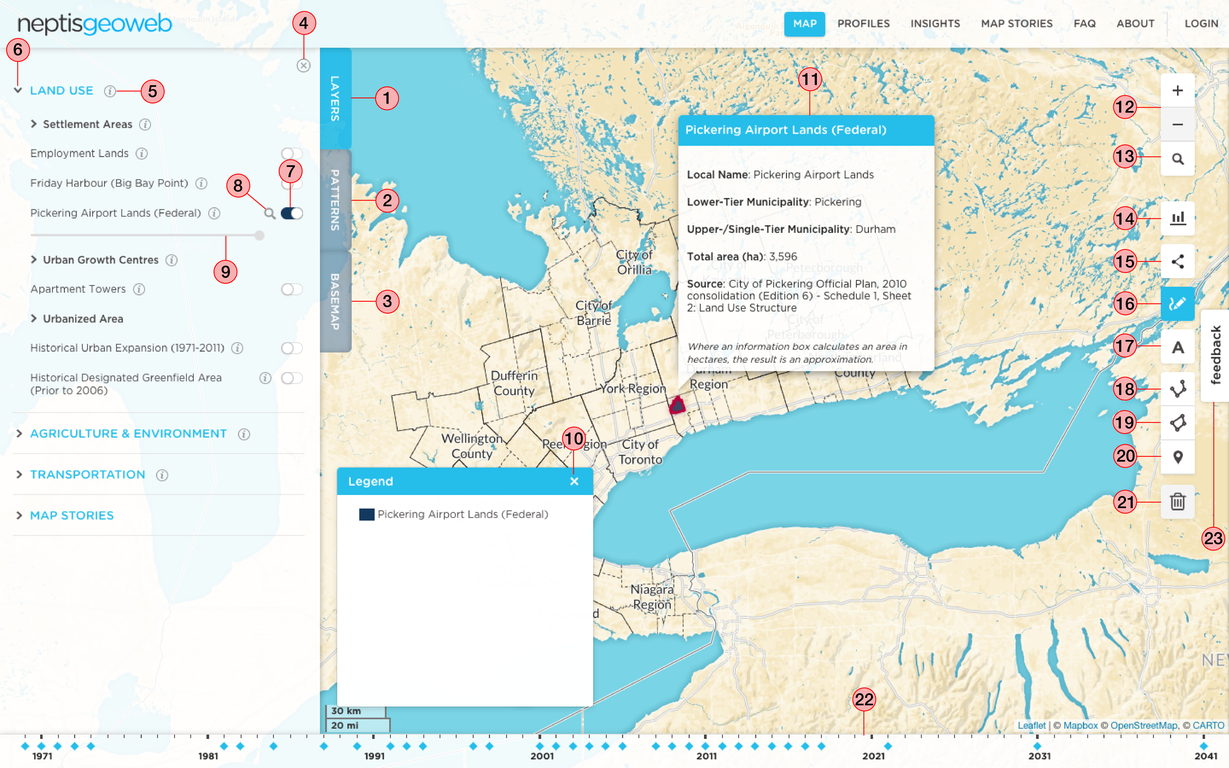
Side Menu
1. Open list of Map layers
2. Open list of Context layers
3. Open Basemap layers
4. Close Sidemenu
5. Tooltip providing short description of Layer Groups and Map Layers
6. Open/close Layer Group
7. On/Off switch for Map Layer
8. Zoom-to-layer: automatically zooms to layer extent on map
9. Transparency Slider: to adjust opacity of map layer
10. Minimize Legend
11. Info Window: provides more information about map layers
Toolbar
12. Zoom controls
13. Search: Find by Lower-, Single-, and/or Upper-tier municipalities, or Address
14. Measure an area: draw a shape to measure an area and/or calculate specified area of a map layer
15. Share a map via a link, email, social media, embed or create a map story
16. Markup tools: Open to annotate a map by adding text, lines, polygons, or points
17. Text: add title or short description to the map
18. Line: draw a line and/or measure distance in metres or kilometres
19. Polygon: draw a polygon on the map
20. Marker: place a marker (point) on the map
21. Delete mark-up: delete any of the lines, polygons, or points drawn on the map
22. Timeline: milestone events within the GGH region
23. Feedback form to leave questions or comments about the Geoweb